Bitcoin managed to hold the price and it has the potential to go higher, Ethereum makes higher highs & higher lows, Litecoin is above the last major trendline

Bitcoin managed to hold the price and it has the potential to go higher
Over the weekend BTC stayed below the strong area (blue line) at $6,767. There were eight attempts to break above but all of them failed.
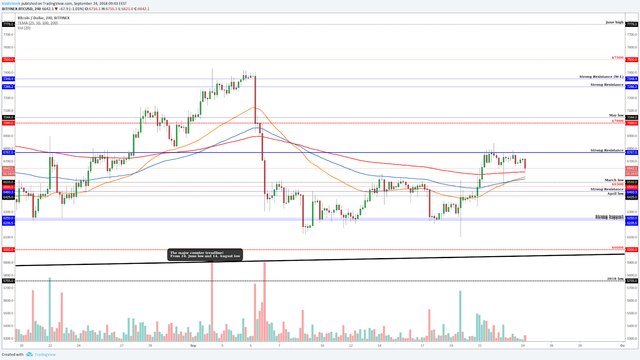
Since Sept. 6, BTC traded between $6,100-$6,500 and on Sept. 21st it made a breakout upwards. Currently, when we had several unsuccessful attempts to break the strong resistance level at $6,767 we got a bounce downwards, this bounce almost touched the $6,500 area which is the perfect scenario if we want to see a bullish Bitcoin. The perfect breakout trade = breakout + retest the breakout area and technically it is ready to climb higher/lower depending on the breakout.
The bounce was supported with EMA's on the four-hour chart. It touches all the important EMA's (50, 100, 200) and after the bounce upwards it closed on the green, which gives us a bullish candlestick pattern called "Hammer.”
To give a weekly overview and weekly direction then, there are several bullish signs on the higher timeframe:
Weekly candle close was pretty bullish, its a "Hammer" or a sloppy "Hammer" candlestick pattern
Daily is above 50 EMA, it has a retest and bounce already
Four-hour, BTC trade above the EMA's and 50 and 100 EMA made a golden cross (which is a bullish sign).
So, we might see a bullish Bitcoin, but currently, we have to take down that strong resistance level at $6,767. To give you a bearish view, if Bitcoin price goes lower than $6,500 then this could be a bad sign because then we are in the consolidation area again. If this happens we don’t know where it is going to break next, several times we have seen a break upwards (luckily) but the next one could be downwards. So, if we move down between $6,000-$6,500 please be cautious.
Ethereum makes higher highs & higher lows but...
After the dump on the Sept. 12th, Ethereum has made a recovery over the 40 percent.
Currently, on the four-hour chart, it makes higher highs and higher lows but those HH & HL are just on the short-term timeframe because September’s high is still far away. In order to confirm a higher high (long-term), we have to climb upwards and break above the round number area $300.
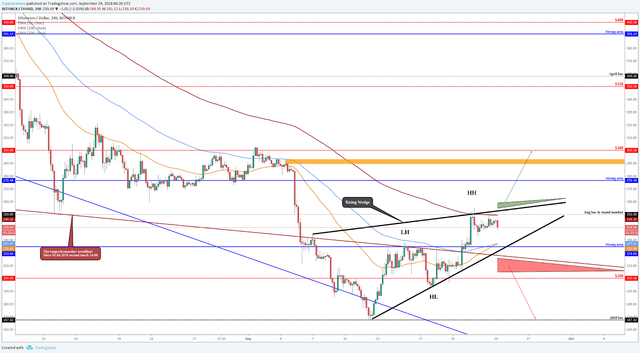
At the moment, ETH price fights with the August low and the semi-round number area which works as a resistance at $250, plus we have a 200 EMA above us which also works as a resistance.
Just a little throwback downwards gave us a bearish chart pattern/continuation pattern "Rising Wedge" (...and the overall trend is down, then the pattern starts to work correctly if we make a breakout downwards).
If we manage to break upwards from this "Rising Wedge" then like we said our first target is around $300. However, to get there ETH has to break a strong level of around $275 and one orange resistance zone, the road above $300 is not easy but it's definitely doable.
If we break downwards from the continuation pattern "Rising Wedge" then the pattern starts to work and confirms that bearish momentum if we get a candle close below the lower black trendline! Also, if we break it soon, then there is also other trendlines and support areas (brown line and blue line), closes below those levels and lines confirms bearishness, let's say a candle close around $210.
Take a look at Litecoin Price Analysis, Sept. 24, 2018
Have a nice day!