You are viewing a single comment's thread from:
RE: Bitcoin (BTC) Evening Update: Sideways Price Action Means Symmetrical Triangle
I would say 50% think were at the bottom and the other 50% say were going to 6k i don't know what to think any more lol
We will see! My guess is when all cryptos bottom out a few led by btc will rocket and people will wait for some Alts to rocket and
Miss the launch again
Luckily i sold all my alts in to bitcoin a month ago, I knew alt season was over lol, It's def bitcoins turn to rally again before we see another alt boom. USDT and BTC only for me :)
Good job you have been upvoted for making a wise decision!
Yeah it is a good idea especially if you can withdraw straight to fiat. But with alts- don't be afraid to grab some on the cheap that you interested in. Because when they rally, they go up fast. I am using this time to buy some coins for masternodes
I agree. There is pressure both ways.
Ive never seen the market so undecided lol And the manipulated looking chart right now is crazy !
This is what is making it so hard to judge and making TA pretty much useless. It isn't following a trend, anyone predicting it is and keeps plotting triangles is just guessing. There will always be triangles or channels that form, that is the nature of a line graph, it is just simple geometry.
It is easy to keep looking for triangles, channels and plotting subwaves after the fact but lately I've found most of the TA I have been looking at is rarely correct and typically only for short term (hourly-daily). So if you are constantly watching it might help you out, but for most of us following this doesn't help.
Just go look at past charts on trading view from "PROS" or even back track on posters on steemit. You will find 25-50% that got the call right that day. Go to a week, their might be 10/100. A month maybe 10/1000, if that. It is pretty much a guessing game at this point.
Use the simple TA tools first: support and resistance. All substantial support has been broken above the 6900 level so look for a test there.
I agree, that is pretty much the only TA that I trust. We have bounced off of support prior at our current level, so if we don't bounce here we are going down to 6900 levels, then 6k.
A (major) reversal may occur once we test the 6900 level. Not until then.
And that is what happened. Does Dark Cloud Cover portend another decline?
What do you think about this analysis?
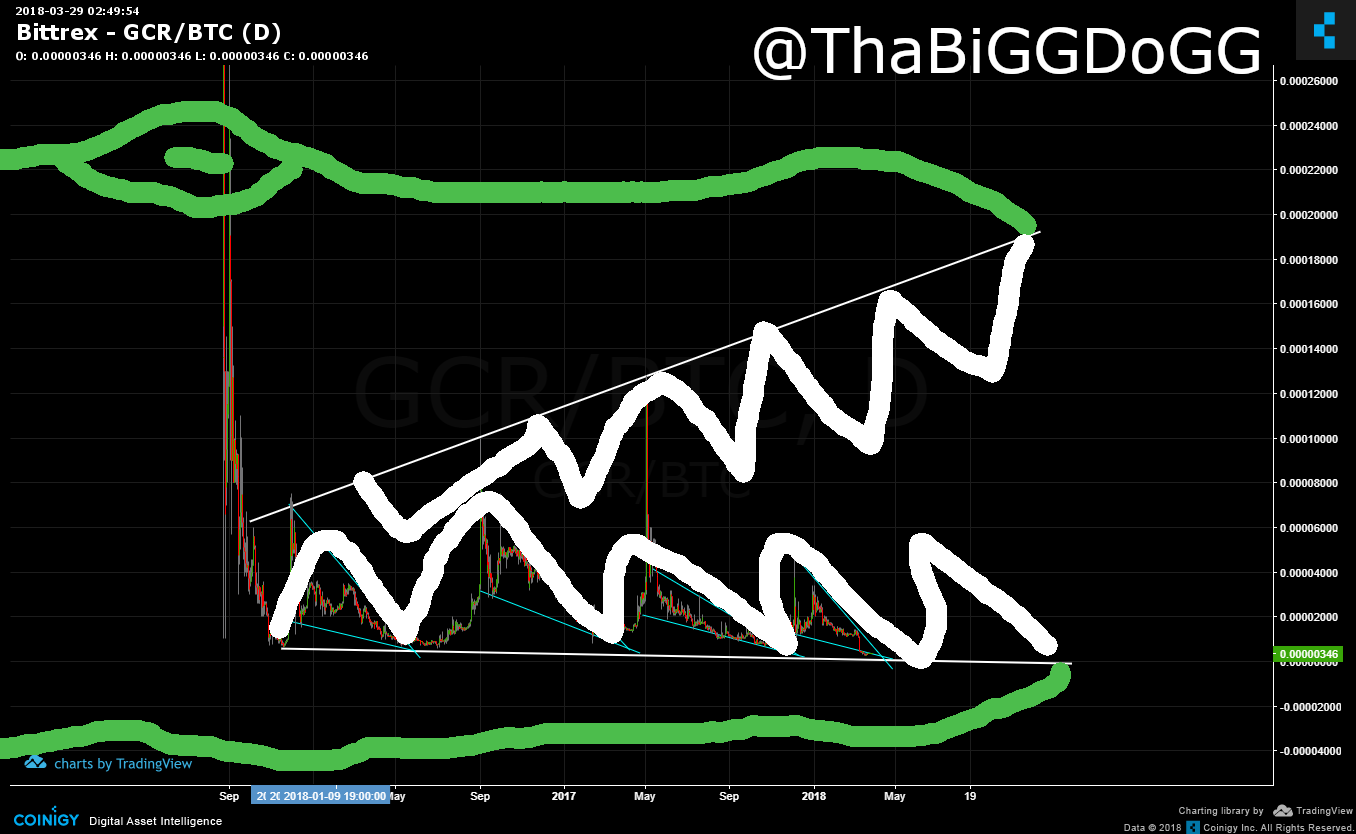
Clearly a gator pattern is emerging. If the gator loses its hodl , the market will go underwater for a while.
You definitely understand your crypto!!!