BTC Price forecast - will history repeat itself?
BTC Price forecast - will history repeat itself?
Then $3,600 isn't out of the realm of possibility
It's been 28 days since my last article about the pullback in the BTC price, when I suggested it looked like it might fall to the $10,000 to $8,000 range. Now that it's done that and had a bounce to the mid $11,000 range where it seems to have stabilized for the moment, I thought it was time to do an update and revisit those price targets.
Of course making price and timing predictions is a mug's game. After all, nothing's more uncertain than the future. And markets do whatever it takes to fool the a most number of people, most of the time. Which is pretty easy actually, given that most people vote with their emotions and wishes, as opposed to the facts and rational analysis. To be successful in the markets however, you need to discount the obvious ('cause it's already priced in) and focus on the unexpected. Another market tactic is understand that markets often move in cyclical patterns. Yes, history often repeats itself. This is because the majority of people are more often than not, as I said, driven by emotions of fear and greed. And this never changes over history.
The last time this happened - late 2013
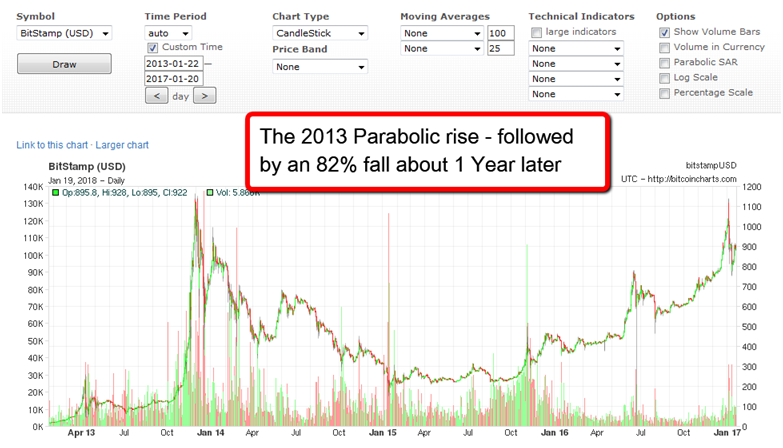
Bitcoin hasn't been around very long so there is precious little history to look at, to identify cycles. But sure enough - in December 2013/January 2014 - right around the same time of the year as this time, the Bitcoin price went parabolic, and in very similar fashion. How convenient! Take a look at the chart below to see what happened then, and see if this might provide clues for this time around.
Notice in the first chart, in 2013, how it ran up all the way from roughly $100 to a peak of around $1,100, or 11 times in price. A ten+ bagger. Then it peaked and crashed. Initially - it dropped roughly in half, to around the $600. There was a tradeable bounce to $1,000. But this didn't hold for very long. After that, it continued correcting and searching for an ultimate bottom until it finally reached it about a year later at $200. A 82% correction. After that, It took about 8 months to form a solid base from which it could move up from. Which it finally started doing almost two years from the peak. And it took 3 years to reach the old highs.
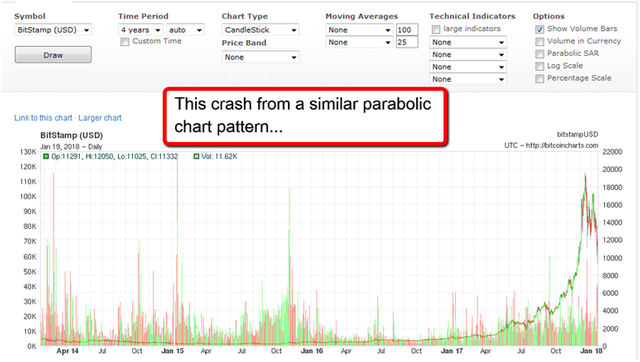
Okay so let's look at what's happened this time around.... Low and behold, this time it move up from roughly $2,000 to $20,000 - an amazingly similar 10x bagger parabolic rise! What a coincidence. And how convenient! This would indicate a similar level of hysterical buying as the last time in this happened in 2013. Okay now the correction, so far - this initial sell off has taken it down to below $10,000 before it bounced, or a drop in half from the high around $20K. OMG - that's JUST LIKE the last time around - again! Okay, so are you beginning to see a pattern forming? I certainly am!
Now - just because so far this parabolic move was almost identical to the last time around so far - doesn't mean that it needs to repeat the rest of the cycle the same way. But just for fun let's forecast some rough targets in the event that it does continue to unravel like it did last time. If that were to happen, it would take a year to bottom out at roughly December 2018 or so. A similar 82% decline would take down $16,400 from the highs, to around $3,600. Another 8 month of basing would take us to October 2019. And it would take all the way until late 2020 to reach its old highs of around $20,000.
Like I said before, the current pattern doesn't HAVE to repeat the 2014 - 2015 Bear market. However, my guess is, in the absence of some kind fantastically positive news, which frankly I don't see happening at this juncture, and given the poor fundamentals (see below) I don't see why this pattern can't play out like the last time. And early bottom fishing attempts would be like catching a falling knife. Something that I personally, don't enjoy doing.
Short term price chart
Finally, let's look at a shorter term chart to see what clues it might give us in terms of future direction.
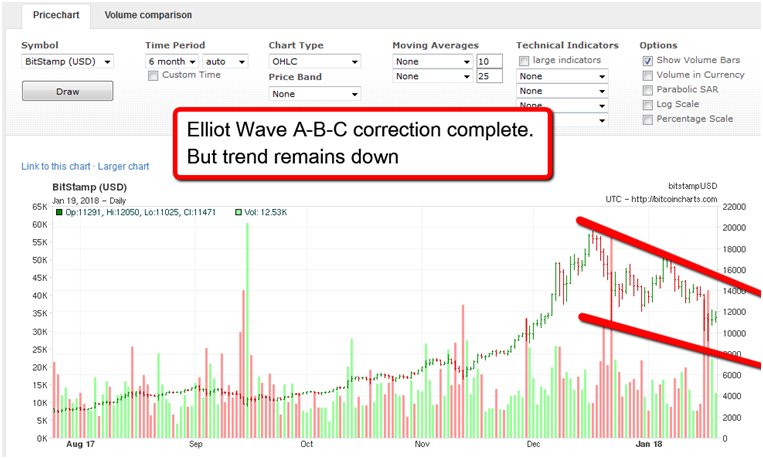
The chart has completed an Elliot Wave A-B-C correction and has bounce off lows around $9,000 to the mid-$11,000 area. The trend however, remains down. We'd need to see a decisive break above $14,00 to declare a trend reversal is underway.
Bitcoin "Fundamentals"
I have trouble trying to assess the fundamental value to the coin. Like for instance, commodities such as gold. I don't know the exact average price of production these days. But let's say for arguments sake that it costs $1,000 to mine an ounce of the precious metal. Then you need to toss in a hundred or three for transporting, storing and a little retail profit for the seller. That would make the current price of around $1,300 - quite reasonable. Besides the price of production, though it's got some intrinsic value as. It's certainly beautiful. It's malleable and useful for jewelry. Not to mention - as a currency - it's performed this roll for thousands of years. As a value investor, we would try to hold out for discounts from this price if possible, and avoid paying high premiums from the fundamental value for it.
But how much does it take to mine a Bitcoin? And what is its intrinsic value? Offhand I have no clue what it costs to produce. And as for the product's usefulness, as far as I am concerned, it's junk. It's slow and cumbersome to use, transaction fees are obscenely high, and it's not secure. All the qualities we might look for in a currency aren't there. IMO, it's only valuable to drug dealing money launderers, and we price speculators. And as long as the price is no longer rising by $1,000 a week, as it was in 2017, I see no valid reason to hold any sizeable amount it.
I apologize if this makes upsets enthusiasts. I'm not here to make you feel better but to tell the truth based on proven analysis and the facts. I'd love to be wrong and for the price to reverse tomorrow and head straight to $30,000. Like I see from the same Bitcoin experts who tried to convinced us that transaction fees were low... But am not willing to lie about it.
Until next time,
Louis Paquette Online
Vancouver, Canada
Nice post! Who knows,,,, the weaker the dollar gets the higher btc will go. Right now there is a lot of uncertainty.
Thanks man. I'm just acknowledging the level of hysteria in December over the upcoming Furtures market trading was epic - after and already strong year of price gains and the price got very unsustainable. Of course a weak U.S. could counter some weakness... cheers.