ARE we DONE with Correction? bitcoin history and How it could impact it's future.
Bitcoin had a bull run in 2013 started in January that went for the whole year ended just before thx giving. Huge price spike from around $10 bucks to at ATH $1164 or so. A whooping 116X return. But what happened after wards is what interest us because we are in that phase. A correction that last over a year until August of 2015 ( over 21 months) retracing nearly 88% to $151 or so. After Aug we started that historical BULL RUN that took BTC to crazy, breathtaking earth shaking ATH $19800 or so in December of 2017. A bull run that last over 28 months. After that as expected BTC went on correction mode, dropped as low as $5900 or so. As we trying to recover from the Deep correction the million dollar question - IS CORRECTION OVER? A low of $5900 from $20k is not even 78.6% on FIB ratio. So are we really done with correction as many pundits predicting already? A 28 months long Bull run and it's correction over in 5 months? Last time in 2013 such correction took over 21 months and magnitude of the bull run is not even comparable with the recent one. We also need to keep in mind that the whole crypto currency and Bitcoin is much more popular than back then. But as the old saying history repeats itself. We need to be cautious here.
Instead of going too crazy lets look at some graphs- A simple ZigZag correction in ABC (5-3-5) format. As you can see we may be still working on Wave B right now. So all who thinking its a new bull Run to the moon could be a very well B wave of ABC zigzag which could retrace up to 79%. By Rule an ABC zigzag B usually retraces from 38%- 79%. Best case scenario B retraces 79% and once you do the math B can end at around $16,880 The exact number recently predicted by @haejin whom I follow day to day basis. But what comes next is C which could take BTC to $2000-$2500 range. By rule C wave always ends beyond Wave A. So if this scenario is a legit call then $5900 isn't the lowest we have got. Also by rule a line drawn through A parallel to the line from (START of A) connecting B will give you an approximate End of C wave. Now for us best case scenario ( we really hope) B retraces 79% but worst case could be only 38%.
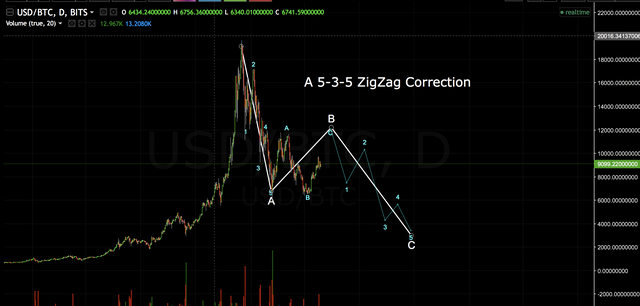
SO BEST CASE SCENARIO C could end at $3200-$3500.
WORST CASE Scenario- C could end $1200-$1500 range( Assuming B retraces 61.8%, B can't retrace 38% here because then C will end in negative)
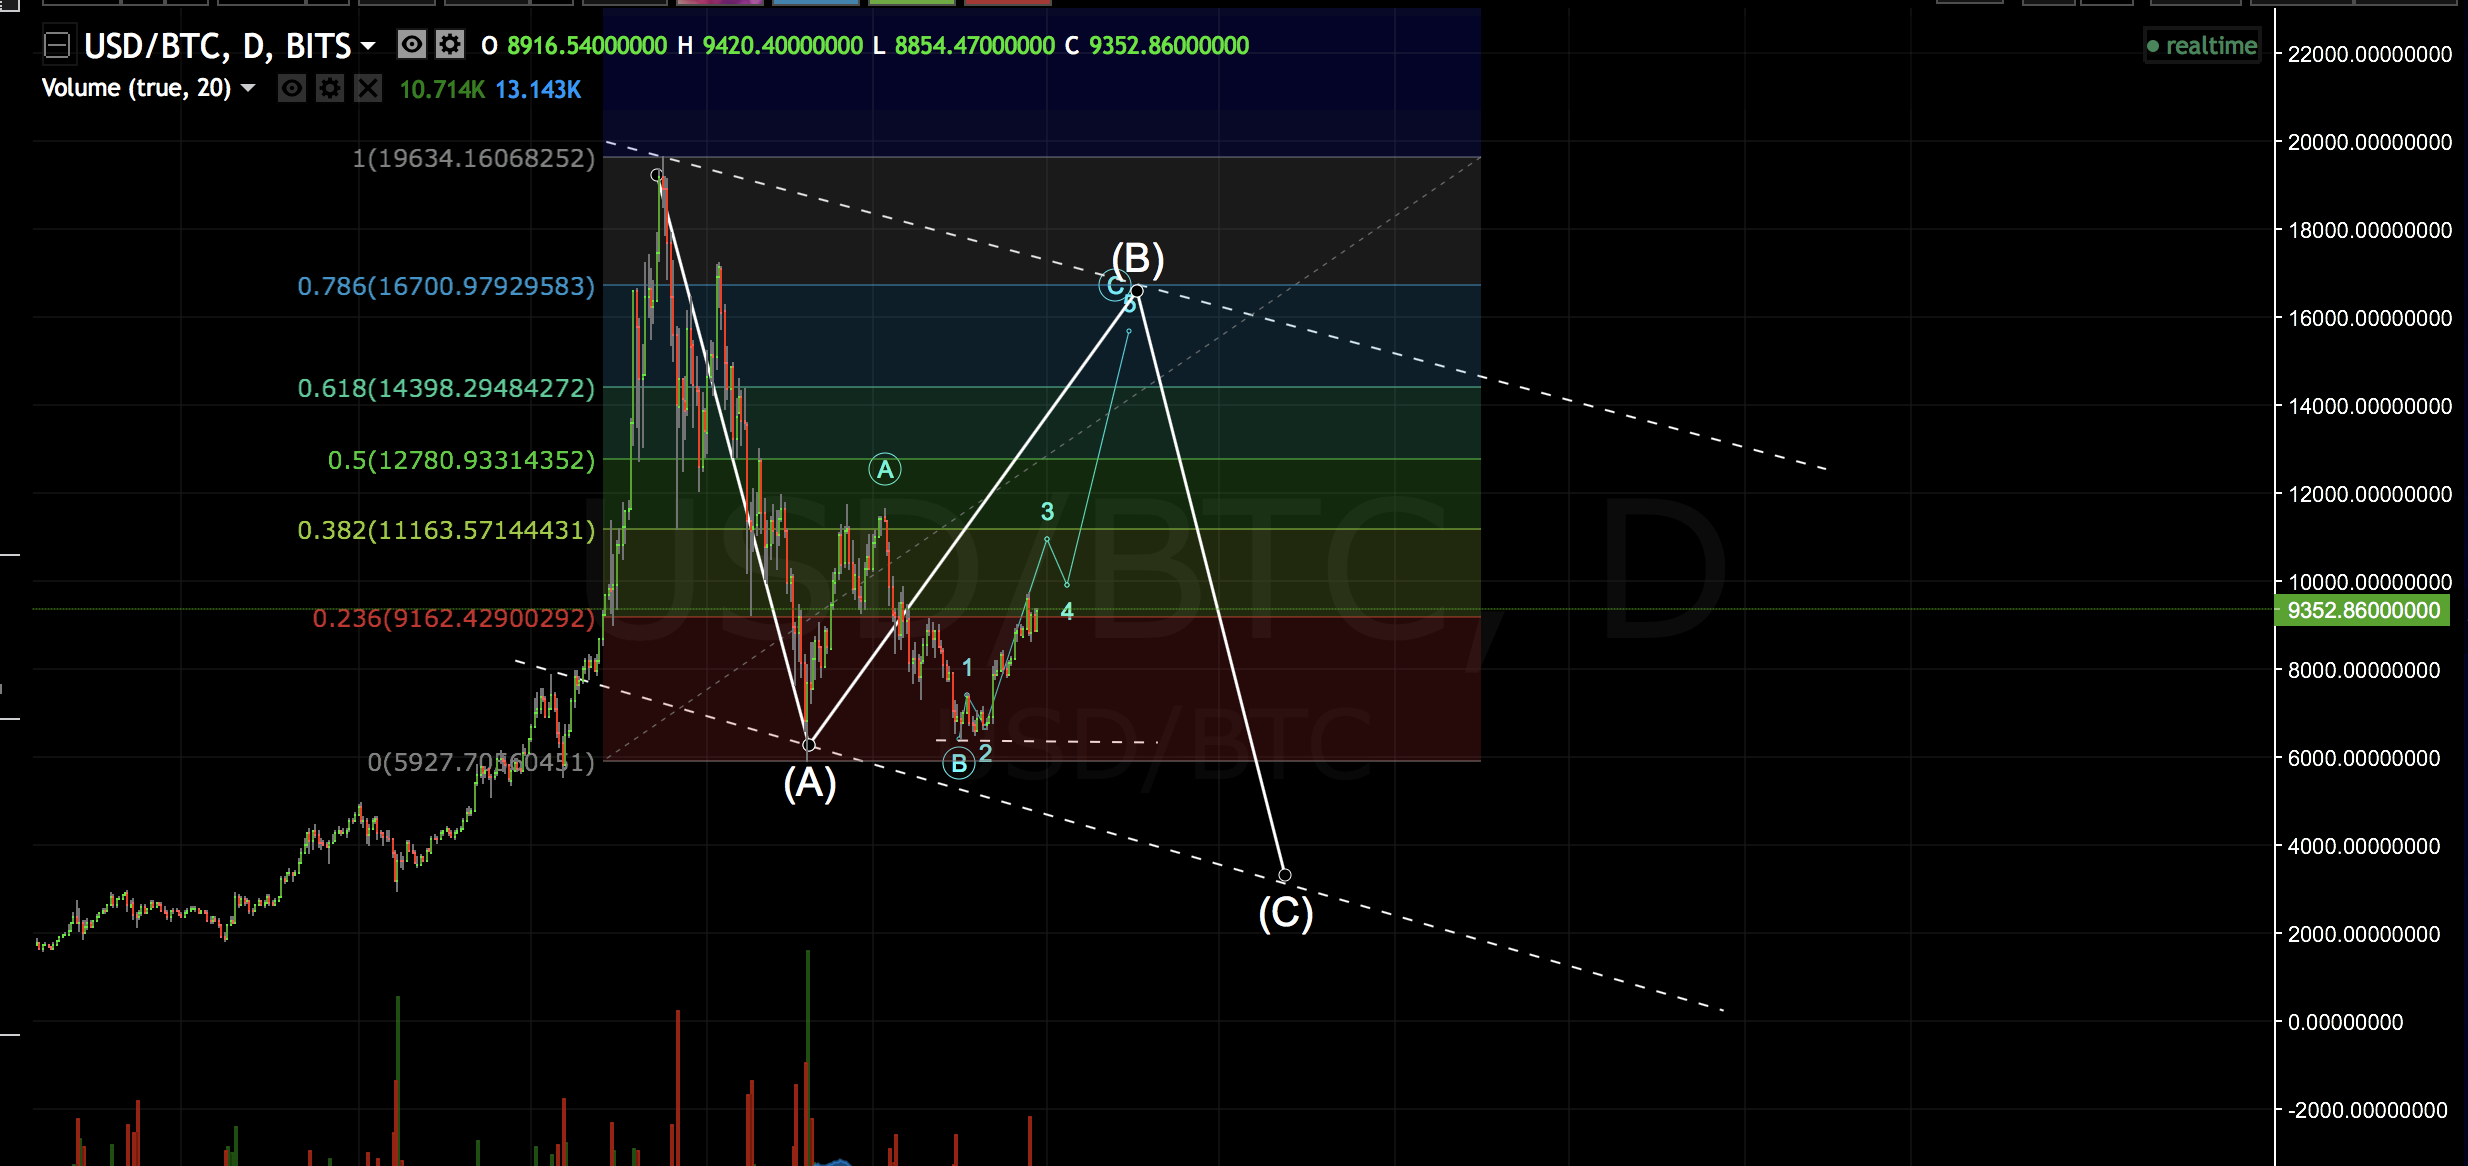
Please note that C doesn't have to end on that white line, it could very well end before it reaches the line. But one thing we know for sure that it will surpass wave A i.e. $5900.
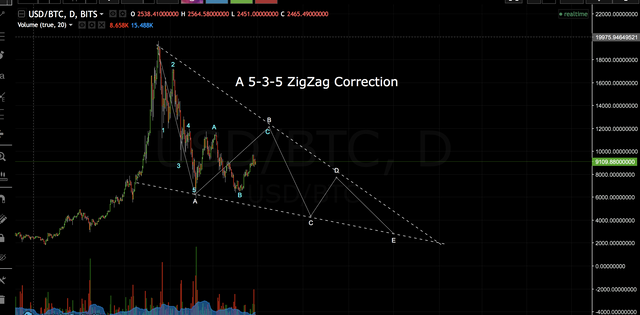
How about a ABCDE triangular correction which what had happened in 2014 and lingers until August of 2015.
These are all possibilities as no one knows what future holds. But we can always prepare for such thing. Please share your comments and opinions. Lets have a healthy discussion no trolling please.
Congratulations @dkalita123! You have completed some achievement on Steemit and have been rewarded with new badge(s) :
Click on any badge to view your Board of Honor.
For more information about SteemitBoard, click here
If you no longer want to receive notifications, reply to this comment with the word
STOPDo not miss the last announcement from @steemitboard!
Congratulations @dkalita123! You received a personal award!
Click here to view your Board
Do not miss the last post from @steemitboard:
Vote for @Steemitboard as a witness and get one more award and increased upvotes!