Macro-Economic Analysis of Bitcoin 2016-2017 #CryptoGates
Hello Everyone,
This is Cryptogates. In this post, I would like to share my recent research findings of Bitcoin's relationships with various macro-economic variables.
For my macro-economic analysis of Bitcoin, I checked for relationships between Bitcoin’s market capitalization with 13 following variables using econometric, using OLS method.
[the words in brackets will represent respective variables throughout my analysis and it's source]
Variables
Wilshire 5000 Total Market Cap Index [WILL5000]
- Wilshire 5000 is a total market index of 5000 U.S. stocks which will represent the US stock market, and gives us clues to the flow of money from American corporations.
Nikkei Stock Average 225 [NIKKEI]
- The Nikkei Stock Average is the index of Japanese stocks which will represent the relationship with Japanese stock market.
CBOE China ETF Volatility Index [VCHINA]
- This is a data of China ETF volatility index and will represent Bitcoin’s relationship with changes in Chinese’s stock market performance. It gives us clues to where the money is flowing.
Trade Weighted U.S. Dollar Index: Major Currencies [USA]
- This is a weighted average of the foreign exchange value of the U.S. dollar against some subset of major currencies, including Canada, Japan, UK, Japan, Australia and Sweden. It will represent Bitcoin’s relationship with U.S. dollar’s strength. High value of this variable indicate greater strength of the U.S. dollar, and vice versa.
China / U.S.Foreign Exchange Rate [CHU]
- This will represent Bitcoin’s relationship with Chinese Yuan’s strength compared with dollars.
Effective Federal Funds Rate [DFF]
- The Federal Funds Rate is the short-term interest rate that banks charge one another for borrowing to meet the Federal requirement of the reserve ratio. It will represent the general direction of U.S. interest rates, since Federal Funds rate is the central interest rate in the U.S. financial market. More importantly, Federal Funds rate also represents the liquidity level of the U.S. economy (money supply); high Federal Funds rate equates to low liquidity and vice versa.
Crude Oil Prices [OIL]
- This is dollars per barrel cost of daily crude oil prices sold at West Texas Intermediate (WTI), which will represent the general cost of oils and perhaps even electricity.
BofA Merrill Kynch US High Yield Effective Yield [CORPB]
- This is an index of low risk/high return corporate bonds that lists average effective yields of each day. Higher risk associated with a corporate bond equates to higher effective yield, thus this will give us clues to the general performance of U.S corporations, as well as peculiarities (one being having high effective yields yet the U.S stock is doing well or the interest is low).
5 Year Forward Inflation Expectation Rate [INFLATION]
- This is an expected inflation rate 5 years later from each day. It will give us clues to the health of the U.S economy and flow of money.
Litecoin Market Capitalization [MCLTC]
- This is Litecoin’s total market capitalization for each day. It will give us clues to the flow of money and effect on crypto-market. Since LTC is highly liquid, a surge in LTC's may give us a clue to flow of money.
Ripple Market Capitalization [MCXRP]
- This is Ripple (xrp) market capitalization. This may also give us clues to the flow of money, but specifically from banks.
Korea/U.S. Foreign Exchange Rate [KRUS]
- This represents Korean currency's strength in comparison with the dollar. Lower the exchange rate means stronger the Korean currency. When a currency gets stronger, it means there is a greater demand for the currency, perhaps indicative of Korean money flowing out, and vice versa.
Japan/U.S Foreign Exchange Rate [JPUS]
- This represents Japanese currency's strength in comparison with the dollar. Lower the exchange rate means stronger the Japanese currency. When a currency gets stronger, it means there is a greater demand for the currency, perhaps indicative of Japanese money flowing out, and vice versa.
Using these 13 variables, I attempted to sketch a big picture of flows of money in macro-economic scale along with Bitcoin as a part in this world-wide process. Before getting to the result, I would like to quickly mention that all these variables are causally related with one another to varying degrees, therefore, the resulting coefficients (literal interpretations) of my resulting data would be biased, meaning they are not absolutely accurate. However, although biased, the general directions and magnitudes that my coefficients provide, along with the precision (t-statistics) for each variable, are quite useful and relevant in drawing up this big picture of the macro-economic event.
I have also used logarithms on all my variables to unify the scale and interpretations of my coefficients, therefore making it easier for all to interpret and understand. The following is the general guideline as to how you guys can interpret my results:
Coefficients:
1% change in (whatever variable) led to (the coefficient number) % change in Bitcoin’s market capitalization.
Ex. 1% change in Wilshire 5000 Market Capitalization led to 8.3377% change in Bitcoin’s market capitalization.
T-Statistic
The t-statistics provides the precision of each variables; therefore, they tell us the relevance of the variables to Bitcoin’s market capitalization movement. If a variable had followed very closely (in sync) with Bitcoin market capitalization’s movement, then the t-statistic of the coefficient will be very high. In general, a t-statistic greater than 2 is considered statistically significant, meaning we can conclude that the variable is quite relevant to Bitcoin’s market capitalization. A variable with statistic between 0-2 can be considered irrelevant to movements of Bitcoin’s market capitalization since there was too much “noise”.
On a quick reminder, when interpreting a t-statistic, a negative sign just tells us whether the variable has inverse relationship with Bitcoin’s market capitalization. Thus, a variable with t-statistic of -18 is highly precise/relevant to Bitcoin’s movement and has a negative relationship with Bitcoin’s movement, meaning when one goes up the other goes down. Lastly, we can also determine directional changes in each variable’s movement in respect to Bitcoin’s market capitalization by noting the changes in t-statistic of varying time periods or varying “lags” – more on this later.
My regression model:
log[MCBTC] = c + log[USA] + log[WILL5000] + log[COPRB] + log[DFF] + log[INFLATION] + log[jpus] + log[NIKKEI] + log[CHUS] + log[VCHINA] + log[KRUS] + log[OIL] + log[MCXRP] + log[MCLTC]
Result:
Sample: 12/28/15-11/28/17
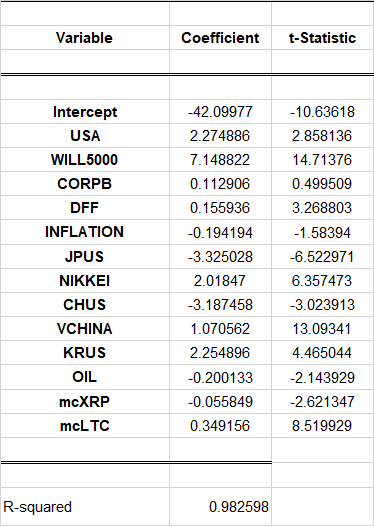
The R-squared of my regression is .982598, which means my variables of the regression captured over 98% of Bitcoin’s movements, which is pretty good I believe.
The result seems to indicate that volatility of Chinese stock market [VCHINA], performance of the U.S stock [WIL5000], LTC’s market capitalization [MCLTC], and performance of Japanese stock market [NIKKEI] are highly and positively correlated with Bitcoin’s market capitalization within the same days, which means they tend to move in the same direction on any given day. Although we have ourselves a highly significant result, this result alone is quite useless when trying to predict the performance of Bitcoin using these numbers since the result is only relevant within the same days.
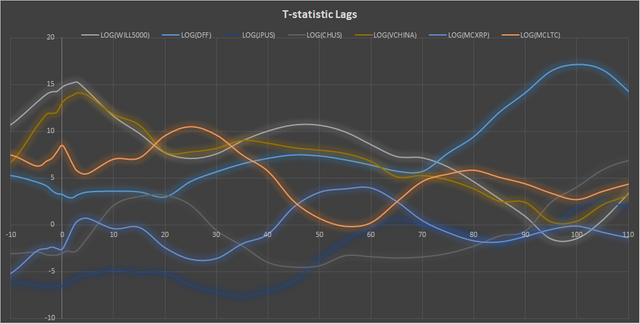
So, in order to make my model to have more predictive information and to give us a better picture of the flow of money, we must push forward (lag) Bitcoin’s market capitalization data compared to the variables and see for any significance.
Due to there being copious amount of data and numbers, I will be brief and concise about the result. The best way (highest precision) to predict Bitcoin’s performance today is by noting the Federal Funds rate 100 days ago, which is quite peculiar since it makes one wonder why does a bank’s interest rate with one another has such a big relevance, among all the other things? Well, I leave the interpretation to you guys. After all, my regression is highly biased and probably be totally misleading. Perhaps someone with more knowledge in this area should give me a pointer or two- I’d appreciate that.
Below is a brief graph of the t-statistic in various lag times, 0 being the result that I showed you in this post which represent today's perspective. As you move across to the right, the t-statistics show the future "relevance" of respective variables. The lines that behave in opposite manner (inverse) with one another implies that the same money is either flowing in/out of those variables. The ones that behave in syn, perhaps indicate the flow of money in the same direction. (except the variables [JPUS], [KRUS] and [CHUS] with all other variables
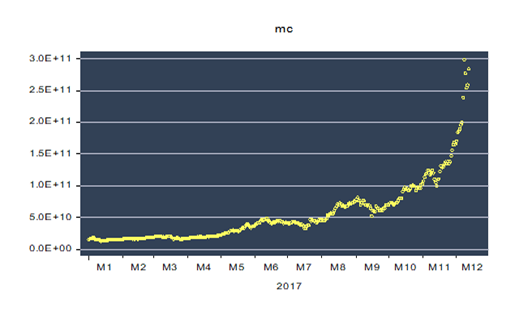
And to help you guys make your own interpretation, below is the 2017 graph of Bitcoin's Market Capitalization. It is important to keep in mind that Bitcoin had an exponential growth in 2016 to 2017.
I don't know what to quite make of this yet, but the book is open for all kinds of interpretation, or none whatsoever. But I think some of the fact may come in handy.
Wish all the best,
Cryptogates
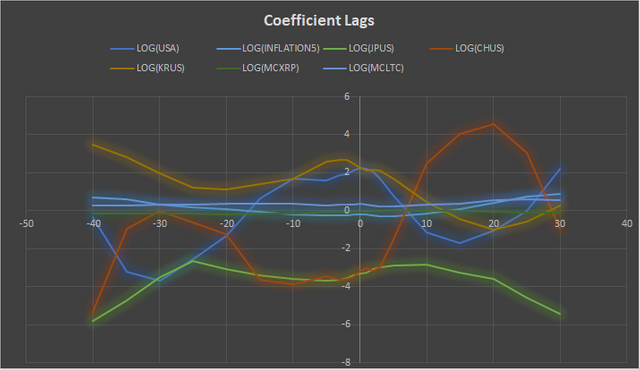
If anyone wishes to see coefficient graph as well:
Much appreciation to Federal Reserve Bank of St. Louise for so much free data.
Congratulations @dksd93! You have completed some achievement on Steemit and have been rewarded with new badge(s) :
Click on any badge to view your own Board of Honor on SteemitBoard.
For more information about SteemitBoard, click here
If you no longer want to receive notifications, reply to this comment with the word
STOPResteemed by @resteembot! Good Luck!
The resteem was payed by @greetbot
Curious?
The @resteembot's introduction post
Get more from @resteembot with the #resteembotsentme initiative
Check out the great posts I already resteemed.
Hi. I am @greetbot - a bot that uses AI to look for newbies who write good content.

I found your post and decided to help you get noticed.
I will pay a resteeming service to resteem your post,
and I'll give you my stamp of automatic approval!