BTC Update: 2-15-18
Price: ~$9,800
24HR:
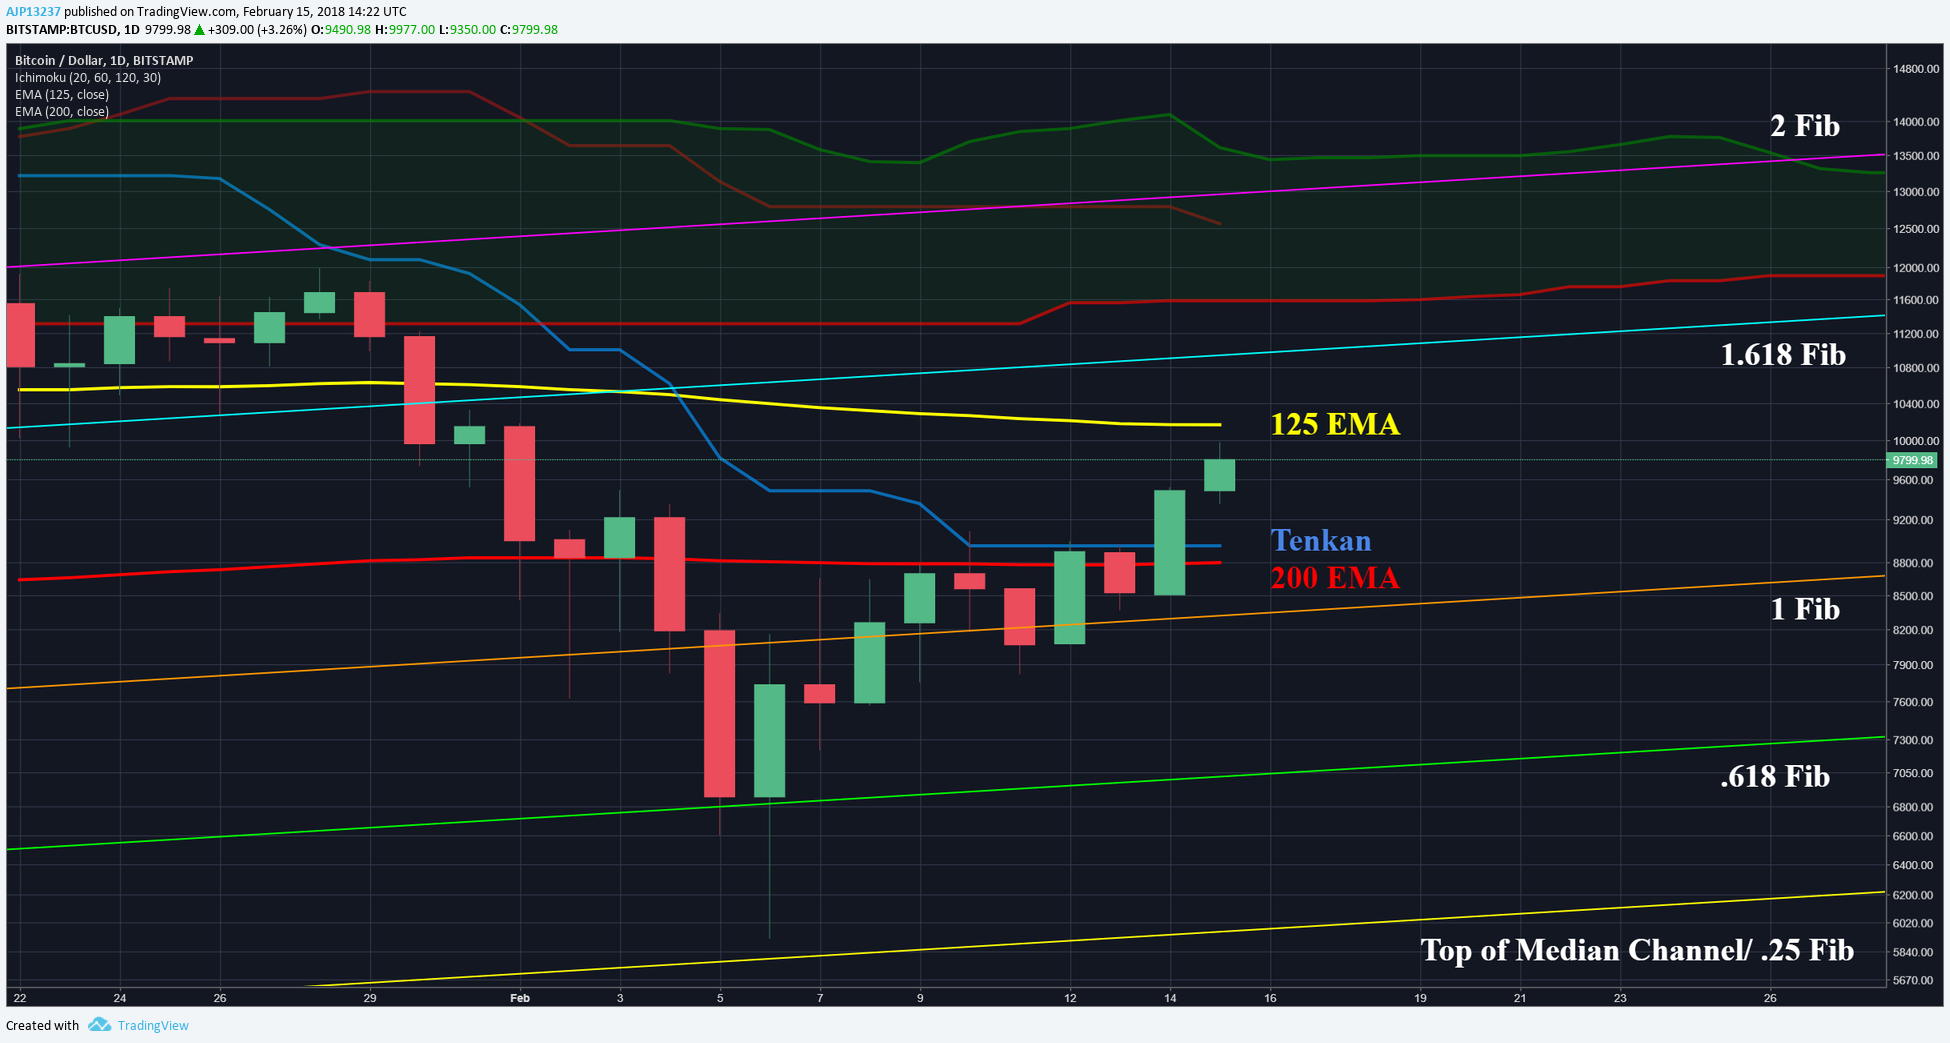
After struggling to get back over the 200 EMA, BTC was finally able to get itself over and has been surging since. The 200 EMA is an important support/resistance area because it had been support for BTC during the entirety of the Bull Run. Notice, after price broke 200 EMA in early February, there was a dramatic price drop. Conversely, regaining this support creates an equally strong push back up. Currently price is right under the 125 EMA, while not as strong as the 200 EMA, it was a support for BTC along the way up & down, therefore it’s likely that BTC does a likely consolidation phase before regaining. However, like the 200 EMA, if & when it does regain that EMA, a strong move back to the bottom of the cloud can be expected.
Speaking of the cloud, the Tenkan also aligns with the 200 EMA & has begun to flatten, indicating stability being created in short term price. Given that the 125 EMA will likely be a consolidation zone, the Tenkan & 200 EMA can be relied on for support unless rebroken.

12HR:
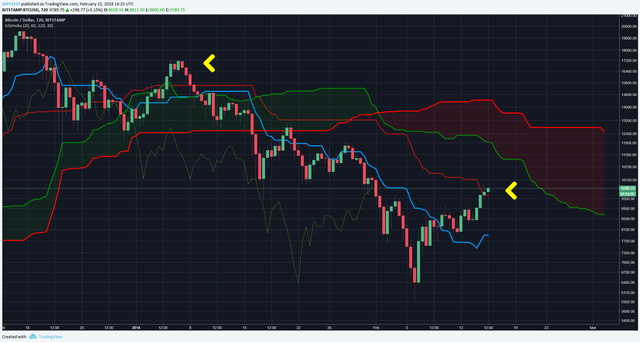
Below notice for the first time since early January that price has popped back over the 12HR Kijun. Between the Teknan & Kijun, the Kijun is the longer average between the two. Therefore, price beginning to catch up with the Kijun is an indication that price is beginning to catch up with the long term trend. A good signs for Bulls.
However, don’t jump to conclusions too quickly, I had mentioned in a previous update that the 12HR cloud cover was looming and will likely be a strong resistance & consolidation zone in the weeks ahead.

4HR:
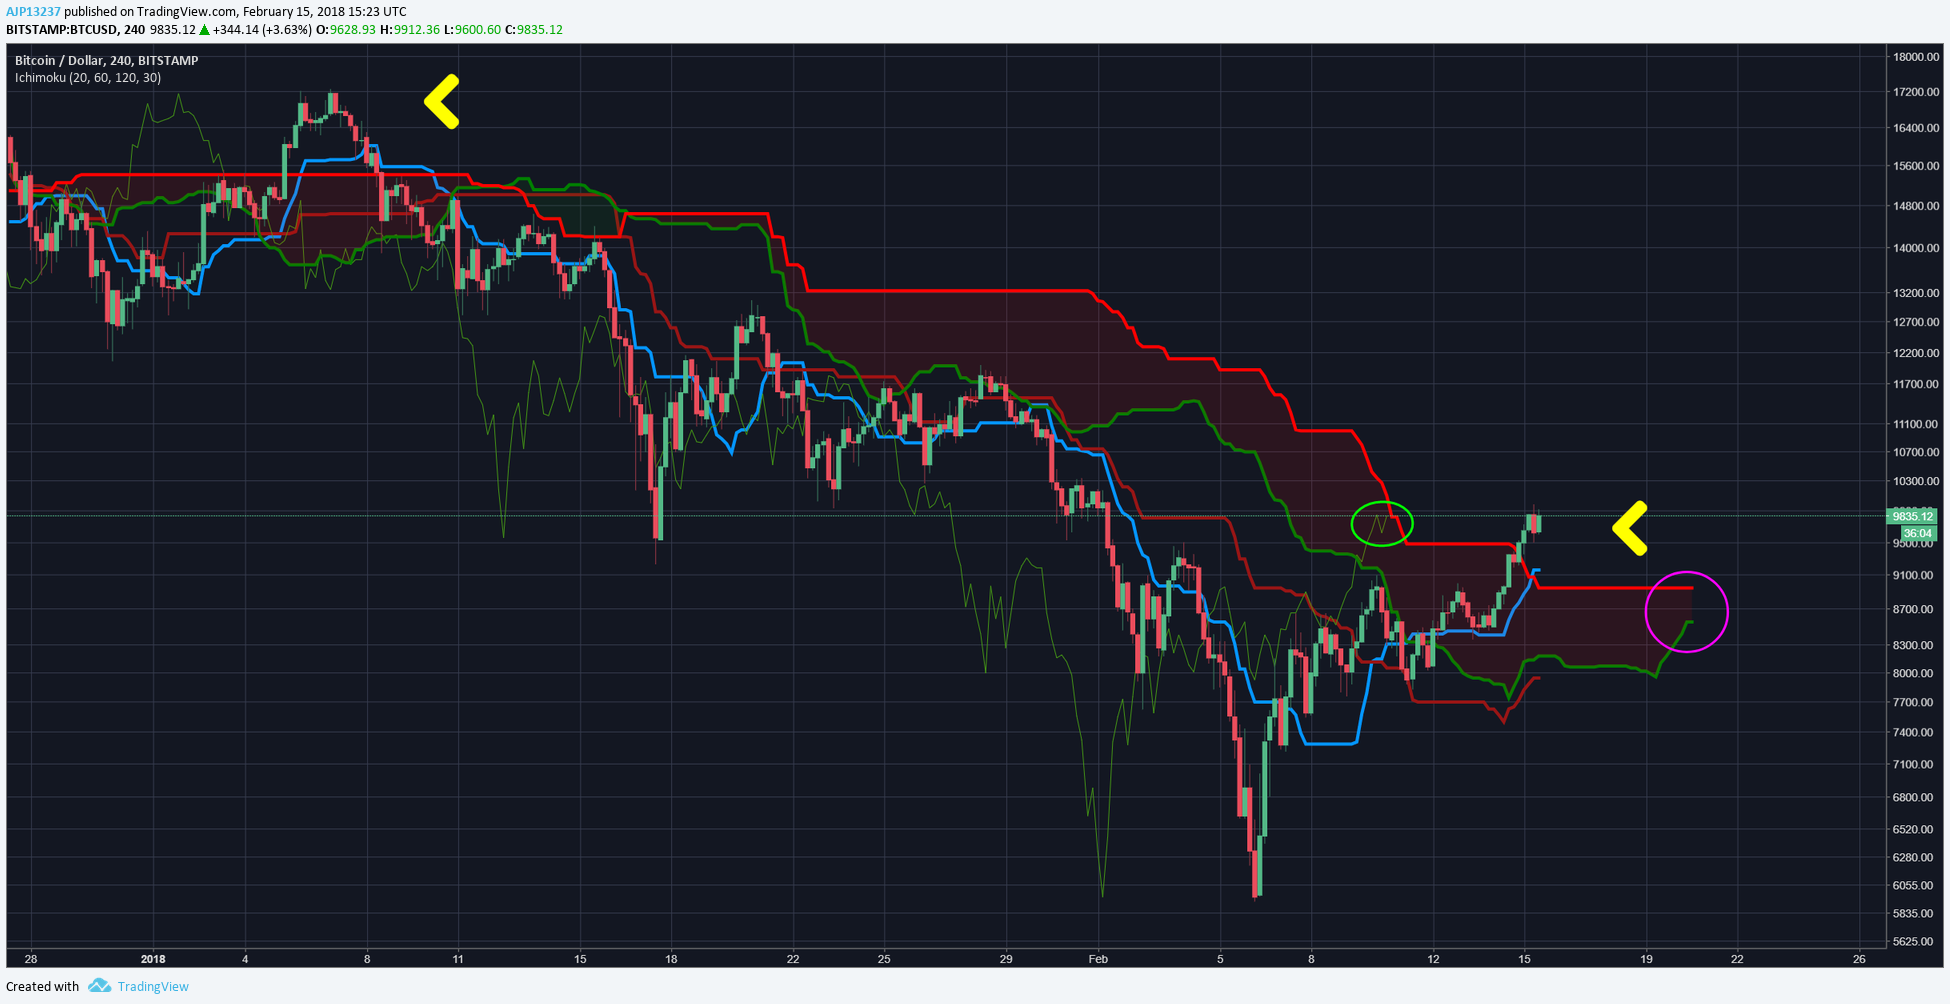
This acceleration in short term price can also be seen with price advancing beyond the 4HR cloud for the first time since early January too. The end of the cloud is beginning to thin as well (purple), another indication that the bears are weakening.
As with the 6HR cloud, it’s not certain that BTC is ready to rally just yet because the cloud has yet to twist bullish and the Chikou are at cloud resistance at the moment (green). The Chikou is the lagging price average and responds to cloud support & resistance as price does. In other words, if the lagging span is not ready to take on previous resistance at this level, the current price will have difficulty. In the event that price does break through though will mean a surge in price.

EMA:
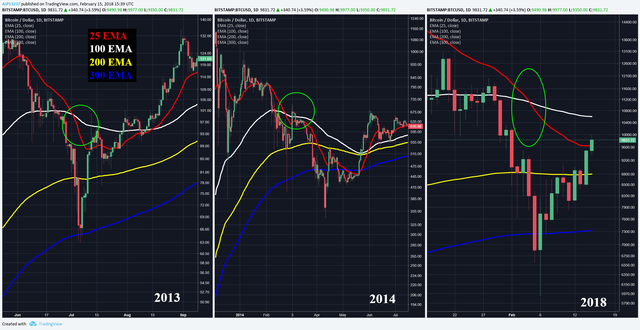
Finally on the EMA BTC continues to share many similarities with 2013 & 2014 pullbacks. In those pullbacks the 25 day EMA (fastest moving average) crossed the 100 EMA and price broke down to the 300 EMA (slowest moving average).
In the 2013 pullback the 25 EMA did not cross with any other EMA & eventually price went into Bull market continuation. However, in 2014 the 25 EMA did cross with the other EMA’s, eventually resulting in Bear market continuation.
At the moment, the 25 EMA looks like it’s beginning to flatten around current price levels, possibly an indicator of an extended consolidation zone. I believe it’s too early to draw conclusions, but another thing I will be monitoring in the weeks ahead.

Prognosis:
BTC continues to flash signs of $6K being the bottom & a possible reversal in the mix. That said, remember BTC broke a lot of support levels along the way to get to this point. Like it took a few months for price to go from $20K to $6K, it will likely be a few months for price to rebuild support back up. In the meantime the 125 EMA ($10.2-10.4K) resistance zone and the Tenkan & 200 EMA ($8.8-9K) support zone will be areas to monitor in the coming days.
If you found this useful & educational, please like, share, & follow.
steemit: @ dogevader
twitter: @ Noob_Charts
Finally, if you have any questions or comments, leave them below & happy trading!