BTC Update 2-22-18: Reversion to The Mean
Price: ~$10,600
24HR:
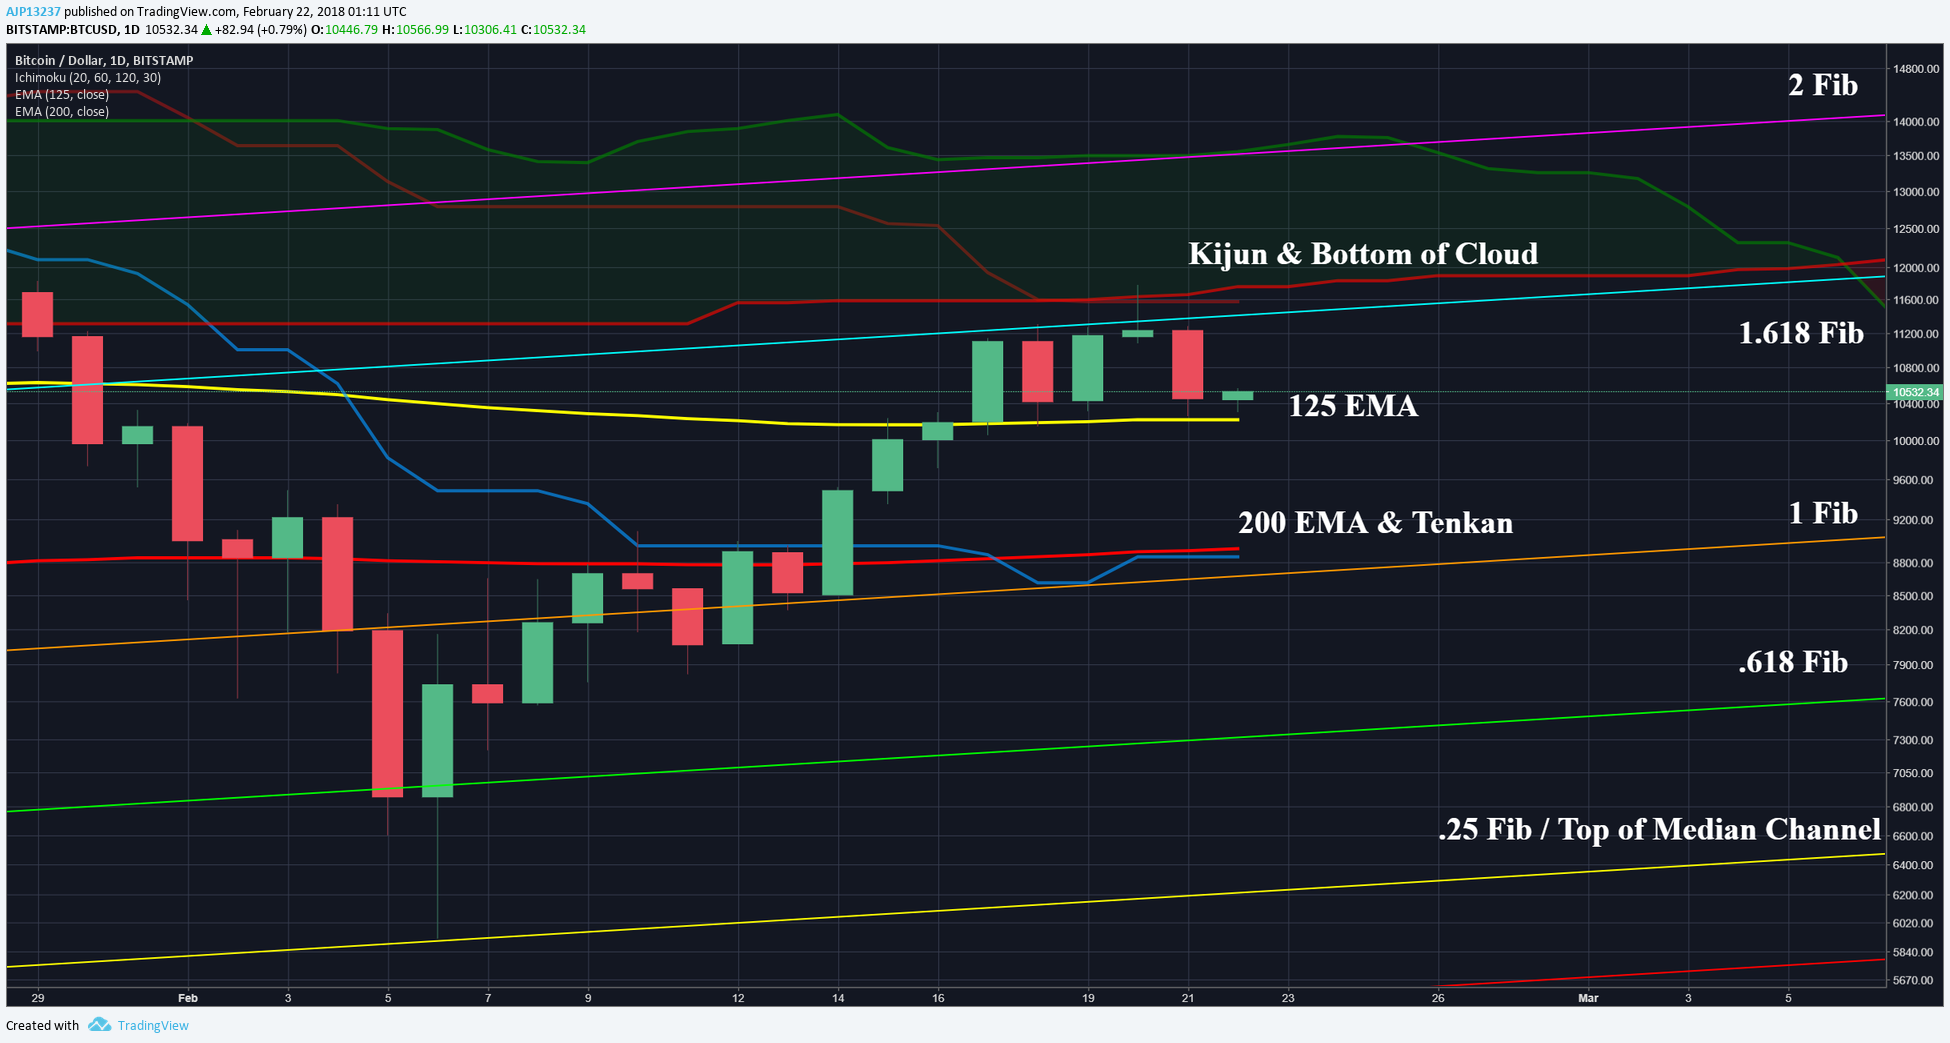
Let’s talk about the Kijun, commonly referred to as the price magnet. The Kijun represents the highest high & lowest low in a period of given time and should not be mistaken for a moving average. A moving average constantly changes period to period because of the new inputs, but the Kijun does not. The Kijun only takes the high’s & low’s of the whole period. This is commonly why the Kijun can go flat for extended periods of time, whereas the moving average will fluctuate. The Kijun formula is as follows:
(Highest high in X periods + Lowest low in X periods) / 2.
X in typical markets (Stocks, currencies, S&P, etc) is 26 (# of days trading days in a month), in the Cryptoverse is commonly referred to as 60 (24/7 market= no off hours & no weekends).
Now that we got that out of the way, let’s talk about what that means for Bitcoin. Price for the first time since mid-January has made it’s way back to the Kijun, reversion to the mean has occurred. However, until price is back above the Kijun, this is firm resistance & partly why price has begun to struggle at this level. Since price touched the Kijun, it closed beneath the 1.618 fib & retested the 125 EMA. As of now the 125 EMA is continuing to hold as support being tested for the 4th time in 5 days.
12HR:
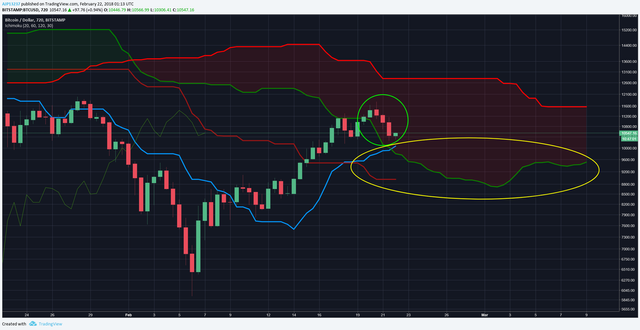
Despite the recent pullbacks encountered as of late, price has managed to stay inside the 12HR cloud (green circle) and the Tenkan (faster version of Kijun (20 periods instead of 60)) continues to rise near current price. This rise in the Tenkan has begun to slow down & will likely flatten soon, creating minor support around current price levels. In the event that price is unable to hold the Tenkan as support, the Kijun & bottom of cloud offer confluence of support $9-10K range (yellow).
6HR:
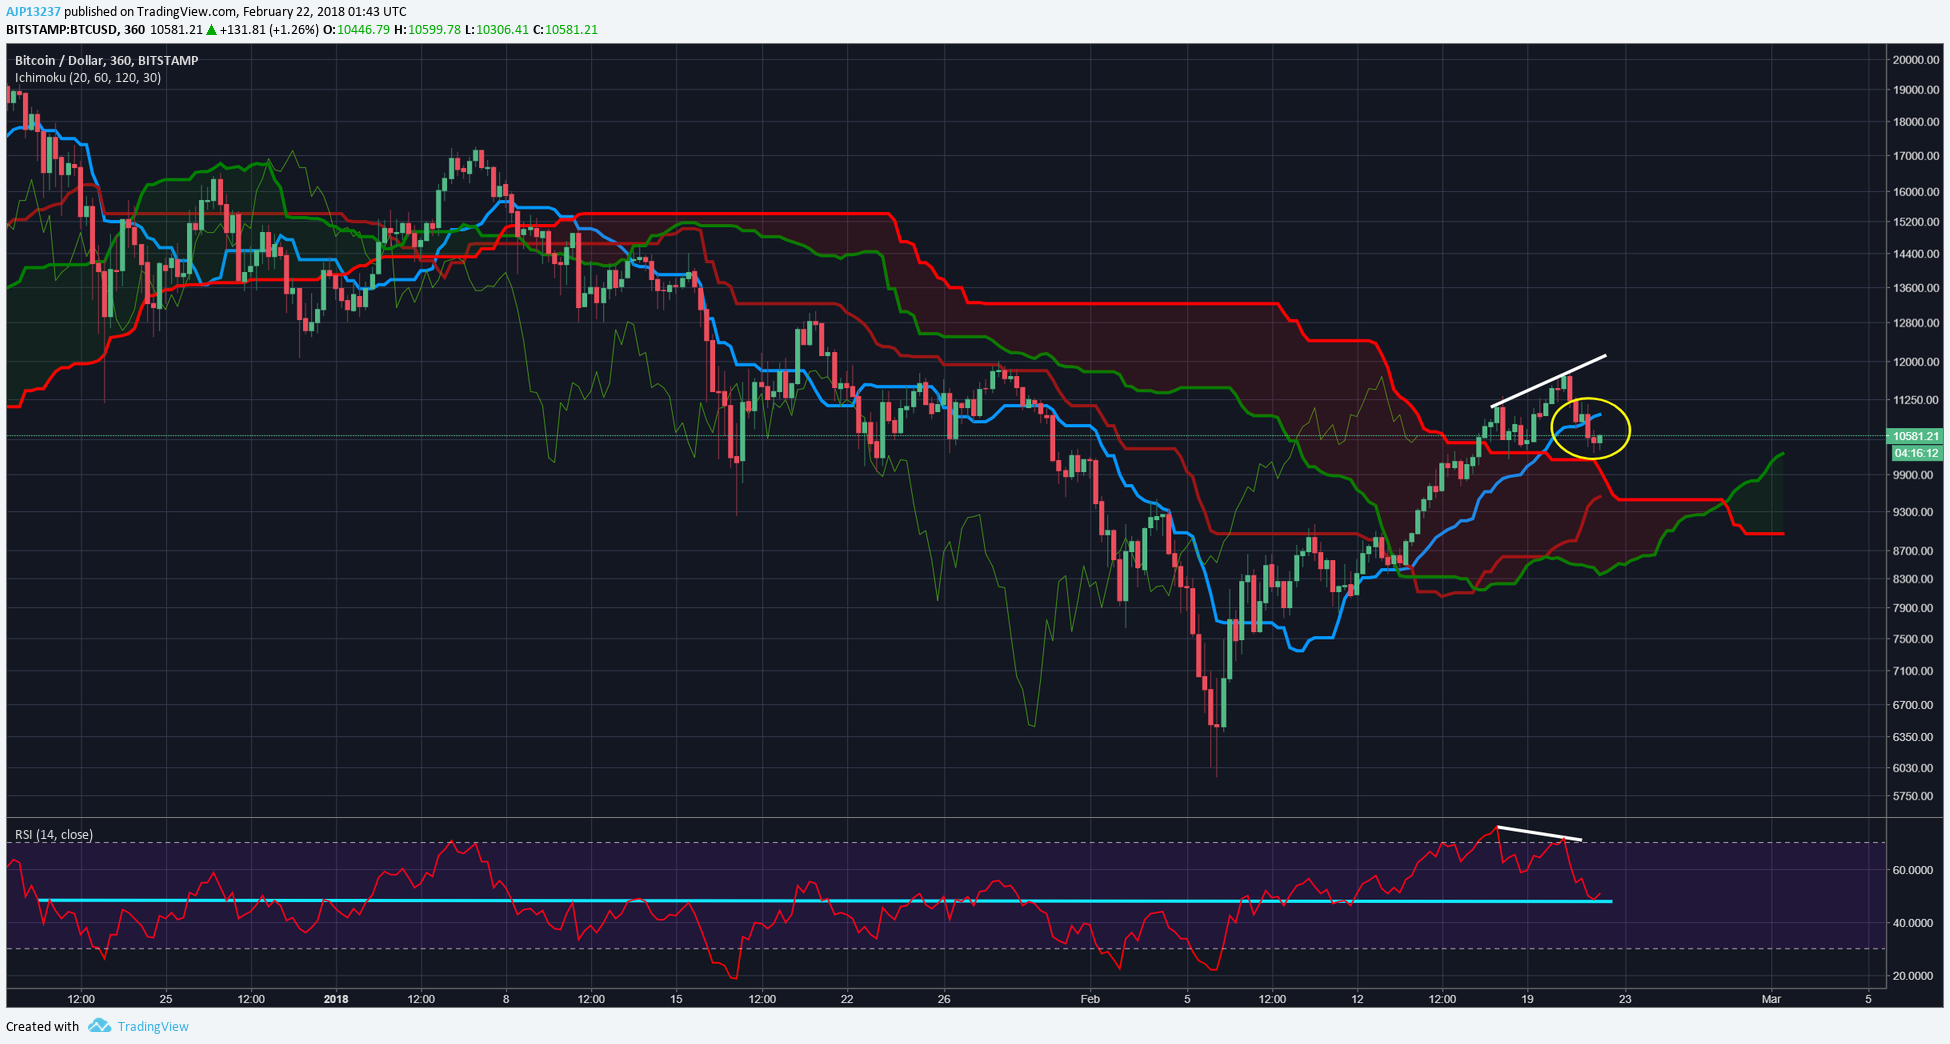
On the short term trend, BTC is beginning to show signs of a bear divergence in price & RSI, meaning that price is attempting to go up, but on less momentum. This said though, RSI has managed to stay above 50, for now & attempting to bounce at this level. 50 is important, because price is typically bullish when above, and bearish below. The deciding factor will likely be how price reacts to the Tenkan resistance around $11K (yellow) and fighting off a potential Head & Shoulders setup.
EMA Follow-up:
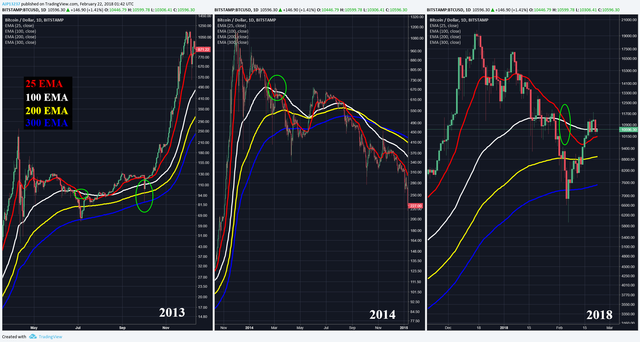
Finally, in previous update’s I’ve discussed the EMA’s as gauging where price is relative to the 2013 & 2014 pullbacks. In these pullbacks is where the 25 EMA (fastest) crossed with the 100 EMA (medium). In 2013, price needed a trip to the 300 EMA, 25 EMA re-became support, & never managed to cross any other EMA’s and eventually price went into Bullish continuation. In 2014, the 25 EMA did cross with the other EMA’s and also needed a trip to the 300 EMA, however price did break the 25 EMA as support and did eventually cross with the slower EMA’s causing Bearish continuation.
As of now, BTC is beginning to exhibit more signs of 2013 than 2014, with the 25 EMA continuing to rise and possibly attempting to re-cross with the 100 EMA. However also notice in 2013 price, that price did revisit the slower moving EMA’s one last time (likely triggered by a FUD event) before bursting back up.
Prognosis:
Price continues to push Bullish, but resistances are starting to align again at this $11-12K price range. As supports began to align to push price up in the $8-9K’s, it would not be unexpected to see the alignment of resistances begin to temporary push price down. In the event that Bulls falter, the confluences of support are around $9-10K range.
If you found this useful & educational, please like, share, & follow.
steemit: @ dogevader
twitter: @ Noob_Charts
Finally, if you have any questions or comments, leave them below & happy trading!