BTC Update 4-4-18: Mired in Mediocrity
Price: ~$7,000
Hello everyone, long time no see! To those that have survived the crypto-pocalypse, I commend you! Apologies for being away a bit, I’ve been a busy Doge in real life and haven’t had enough time to write lately. There’s a lot to catch up! I’ll do my best to both recap recent price action as well as talk about what to be on lookout for. Let's get started.
Cloud & Pitchfork:
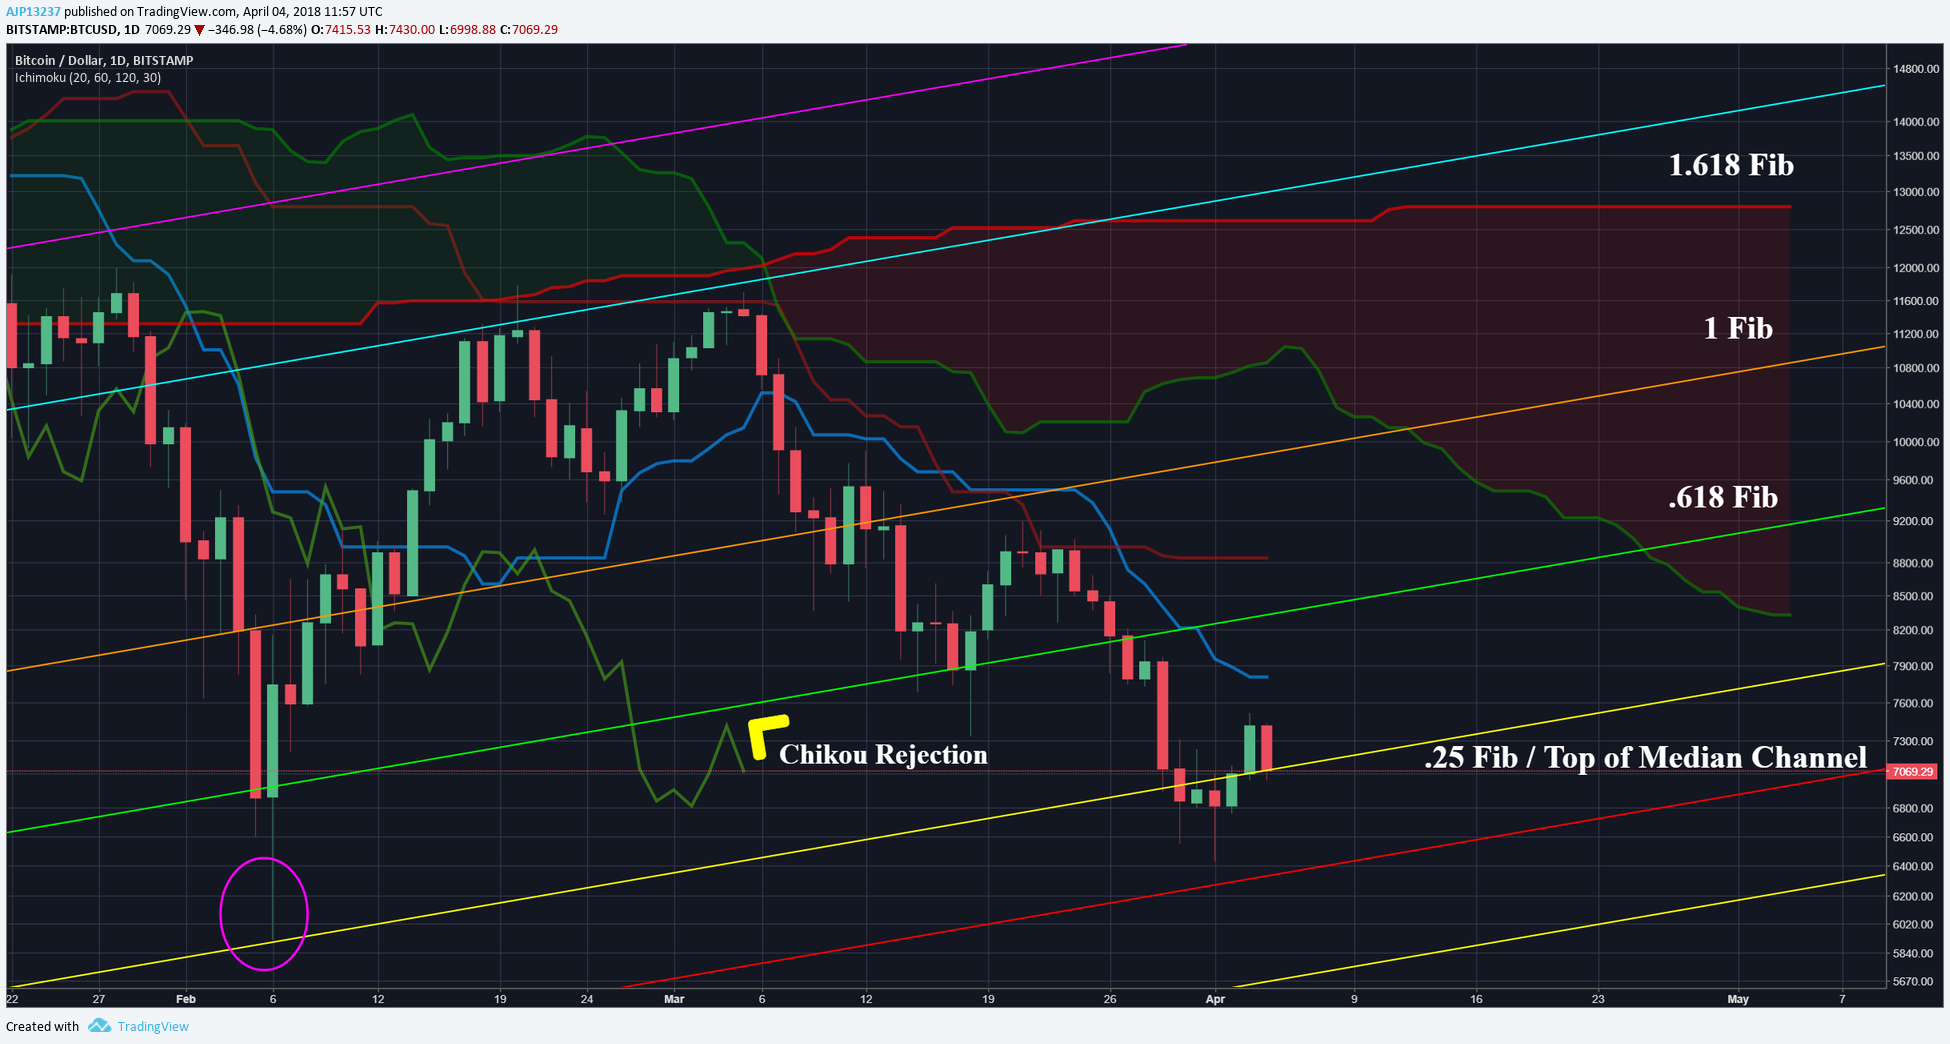
Recap:
Since last update , the daily Kijun has remained relatively flat & price has been in free fall mode since the rejections of $9K. While the Kijun has been flat, the Tenkan has not & recrossed bearish last week. The cloud resistance has grown considerably, with hard resistance for bulls hovering around $8K at the moment. Finally, the pitchfork is showing BTC has been hovering around the .25 Fib (purple), which was support during the $6K pullback in February.
Current:
As mentioned above, many cloud indicators are heavily bearish at the moment and will remain so till BTC gets back inside the Tenkan. Also notice that the Chikou is receiving rejection of the .618 Fib (~$7.6K), meaning that past price has found resistance at this level, confirmed by pitchfork fib.
BTC is hovering around the $7K region, an important area from a pitchfork perspective, as the .25 Fib (purple) was support during the $6K pullback. Re-breaking of this fib support, would likely mean BTC at least revisits the median trend line / local low in the mid $6K’s. However, like the cloud, pitchfork fibs perform Edge to Edge moves as well and an edge to edge move for the median channel would be a dip to $6K again. Finally, this is potentially significant because it would be the first time since mid-2017 that BTC dipped below the median channel & could signify hard resistance for Bear market for quite some time.
Inverse Cloud:
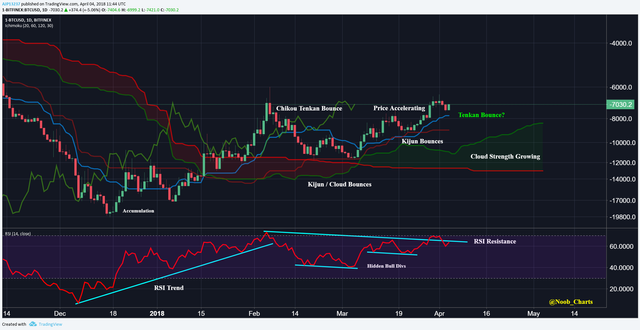
Recap:
For those that have been following along, the inverse cloud has been a fascinating indicator to watch during this Bear market. Since we last spoke, the Tenkan & Kijun have been strong support for Bears, creating four strong rejections for bulls & allowing bear continuation. Finally, as mentioned above, cloud strength continues to grow for the Bears, indicating that even if BTC does find a reversal, there will be strong support for Bears $8K+.
Current:
Price was able to find support near the Tenkan and while not a true bounce, is plausible at the moment. Price is hovering around yesterday’s open, this will be the tell if the bounce is real or not. Break through yesterday’s open & Bears can begin to open up & attempt for the local high (mid $6K’s). However, it will be contingent on how the RSI trend follows, at the moment the Bears are currently wedged under RSI resistance, break through & continuation, otherwise potential breakdown.
In event of continuation, BTC will begin to push into the $6K’s & may be able to attempt or break the local high of $6K. In the event of breakdown, there’s a plausible Head & shoulders developing from the mid-March till now, I believe it’s too early to say just yet, but something to be keeping an eye on, in which case would bring BTC back to Kijun around $9K.
Daily EMA:
For those unfamiliar with the EMA follow-up section; BTC shares similarities with the 2013 & 2014 pullbacks in that they were large & drawn out enough to cross the 25 EMA (Fastest) & 100 EMA (Medium) and needed to find support around the 300 EMA or lower. In 2013, there were no further crosses & once price and EMA’s properly re-crossed there was bull continuation. However, in 2014 the 25 EMA crossed with the other EMA’s and eventually price followed for bear continuation.
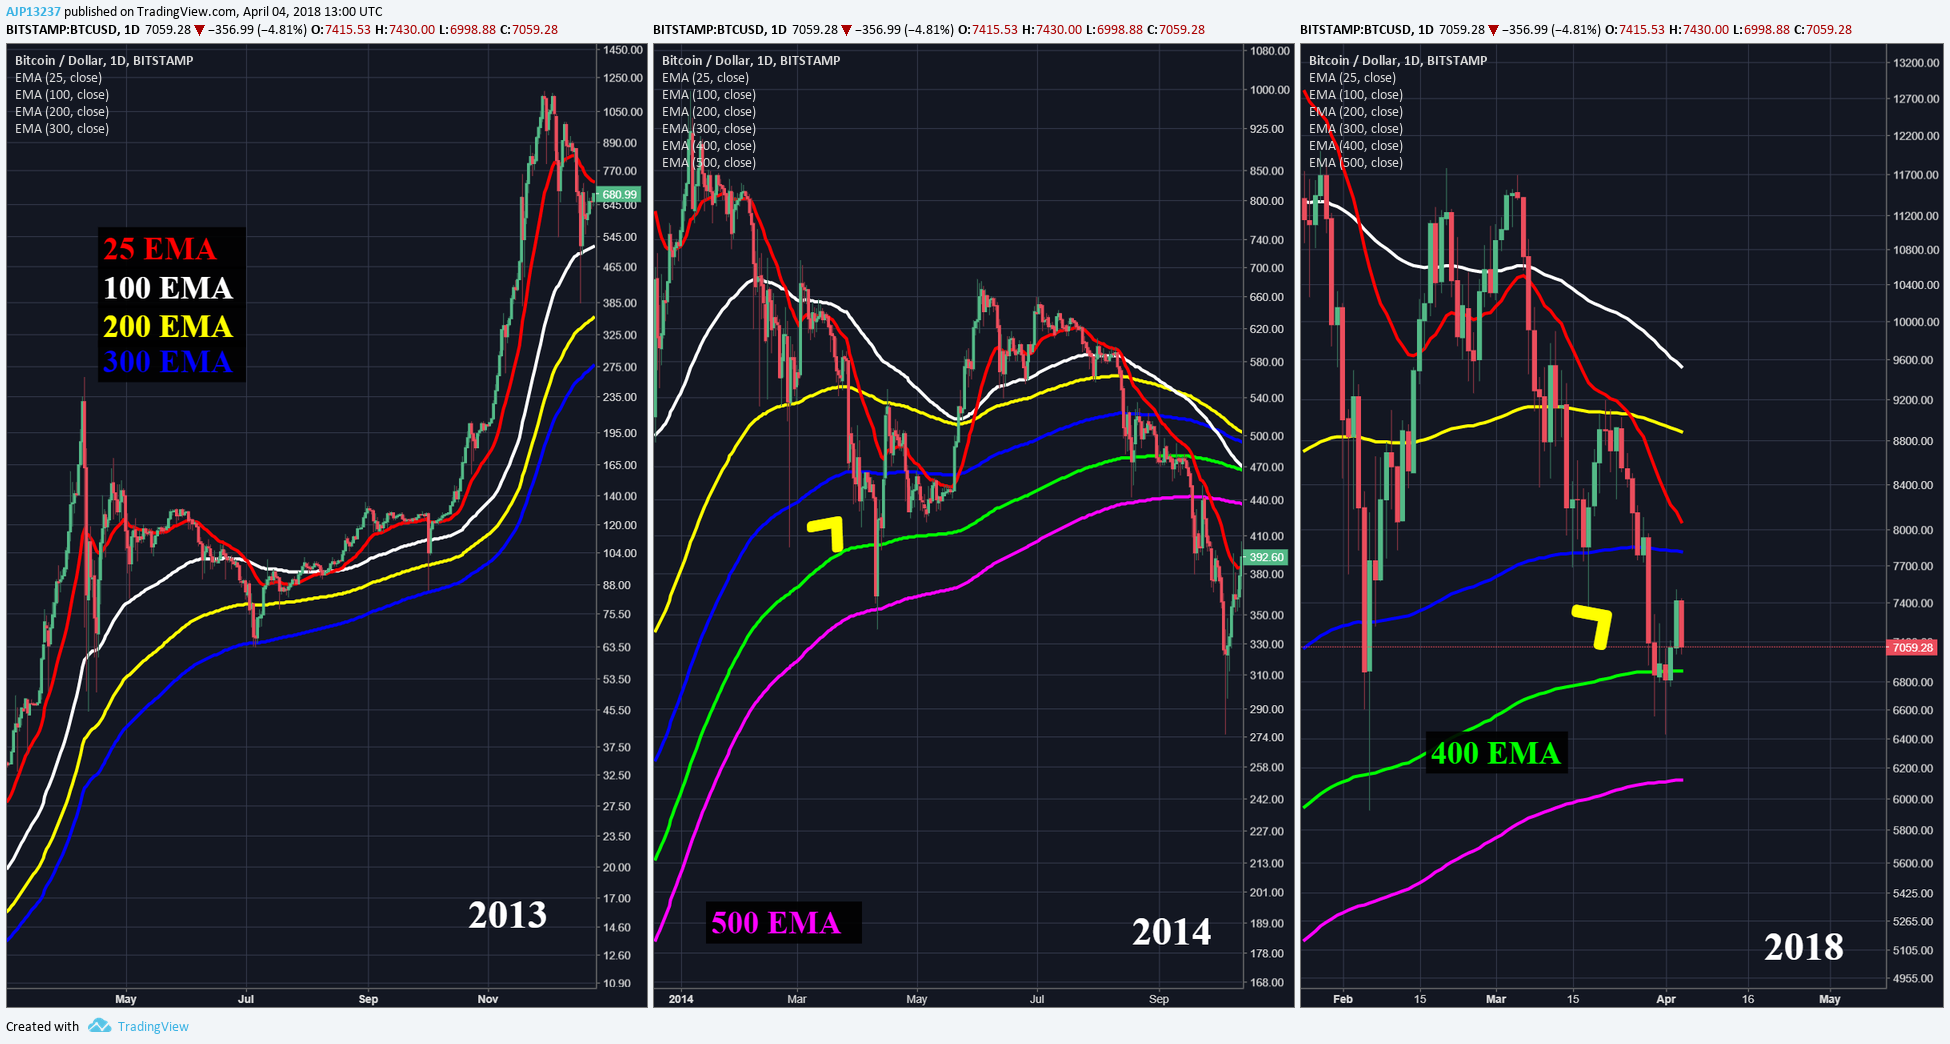
Recap:
The 25 EMA continues to dive & has re-crossed with the 200 EMA, which for all intents & purposes kills the 2013 setup from my perspective, and confirms the interim Bear market with the 200 EMA (~$9K) being the hard resistance barrier. However, this does not automatically mean there will be a full on 2014 either, that’s still too be determined, but for all intents & purposes 2013 setup is officially dead.
Current:
Price is below the 300 EMA & attempting a bottom on the 400 EMA, however also notice that the 25 EMA is quickly approaching the 300 EMA and likely will cross given that price has stayed below, which will be a strong signal for bear continuation. If BTC does follow a similar pattern to 2014, I believe BTC is around the yellow arrow, which if plays out could create a panic to the 500 EMA ($6K) or lower. In the event that this does play out similarly, there could equally be a FOMO surge back to the 200 EMA (~$9K), but as mentioned earlier, this will now be hard resistance for the Bulls.
Prognosis:
BTC continues to feel the illness of the Bear market and is nearing a crucial stage. There are a confluence of strong resistance ~$8K+ and support ~$<6K, whichever of these budges first will likely set trend for the next few months+. At the moment bears have momentum on their side, however BTC is also looking like it could be setting up for an extended sideways the longer Bulls defends the $6-7K bottoms.
If at any point you find these charts too small to read or want to zoom in, simply right click on the chart & open in new tab for full view.
If you found this useful & educational, please like, share, & follow.
steemit: @ dogevader
twitter: @ Noob_Charts
Finally, if you have any questions or comments, leave them below & happy trading!