Bitcoin TA - summary of analysts - 06. June 18
Regular daily update on BTC ta analysts opinions.

**My summary - short-term sentiment: slightly bearish ** (last: slightly bearish)

It seems area of 7'350 holds - we are back up at 7'600.
Situation looks not too strong - the bounce of the bottom of the symmetric triangle is weaker than the once before.
Do we go up to the top of the triangle at around 8'000-8'200? Do we break out from there?
Or does the bears crush us below 7'350 and than 7'050?
@haejin: He is posting bitcoin only on bitcoin live anymore. I am trying to reach out to him to see if we can have an abstract here.
- May is usually a strong month. But not this year. We started at 9'240 and went all the way down to 7'485 (-19%). Lets see how June plays out -usually also a bullish month. Are we going to see a compensation of May with a huge rally up?

News about the blog
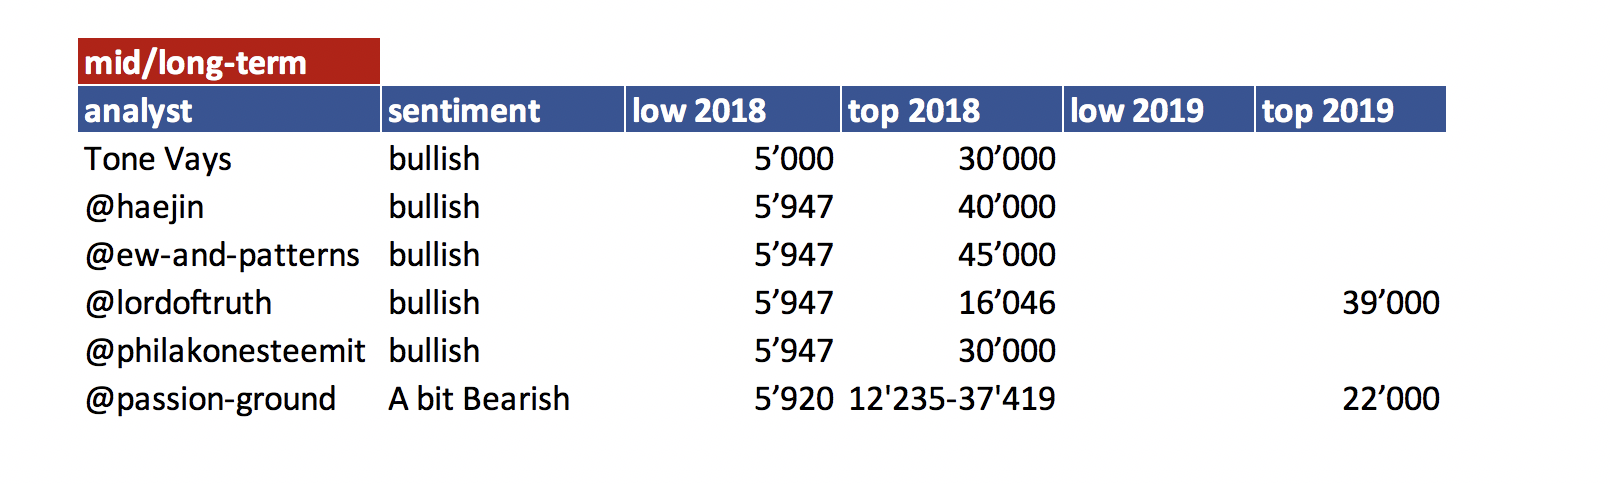
I need to revise my 2018 long term table. I need to add a 2018 and 2019 target an be more precise on the sentiment here. Will do that after I am back in Switzerland.
We lunched the bounty project beta. If you are interested and you like to create a bounty on your own have a look at this post
Analysts key statements:
Tone:
- Weekly: He still compares chart with August 2014. After a week like the last we set of 6 weeks of downside. That is what he expects to come. We are working on the first weak one.
- 12hr: Symmetric triangle still in play. CMF is very weak for being at the bottom of the triangle.
@haejin:
@haejin is moving his analysis to bitcoin live. Those of you who want to follow him directly should look into subscription. I will try to get in contact to see if I can use an abstract to post here also in the future.

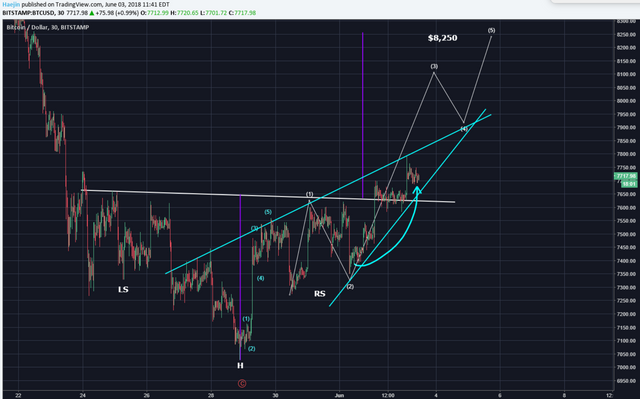
Bitcoin did a small surge to decisively breach the Neckline of the Inverted H&S pattern. The target for the minimum run for the IHS is 8'200. However, keep into awareness the upward pointing wedge pattern (blue lines). Price will likely go sideways again for most of the day and if there is one more surge, it will either breach the top blue line and invalidate the wedge pattern or validate and confirm it with a decline.
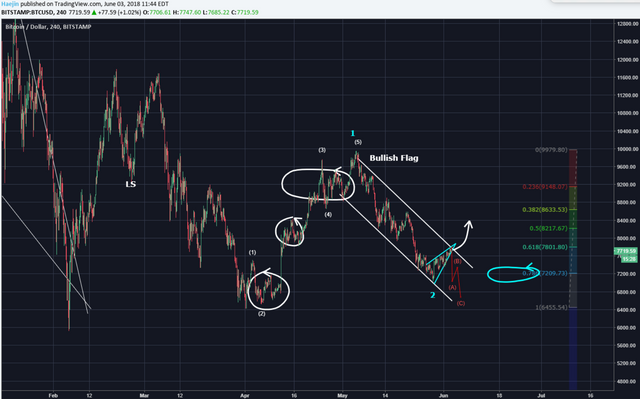
The bull flag pattern is still in progress. Note how the wedge pattern is now sitting just below the belly of the upper white trend line. So, a decision needs to be made. An upside breakout would provide the pathway to the 8'200 target for IHS. However, a downside could jive well with the MACD progression. What does this mean? The next chart clarifies.
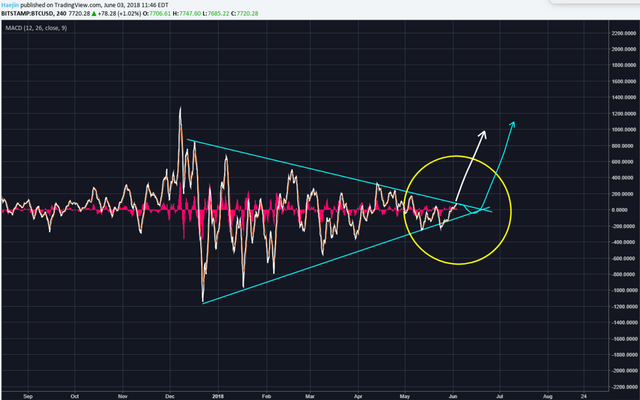
Note how the MACD is at the belly of the upper blue trendline. I believe it could do one more turn down towards the lower blue trendline. This turn in MACD could also mean the 6'700 level or so.
@ew-and-patterns:
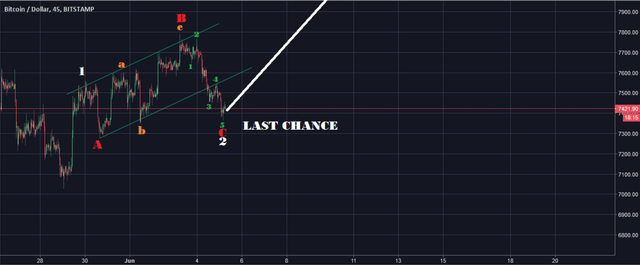
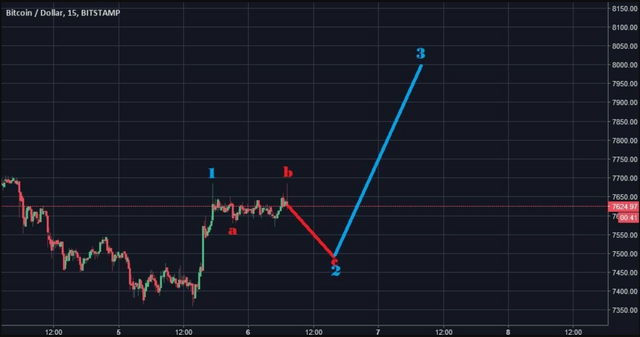
The bearflag was broken to the downside.
Last chance for this mini uptrend. If it crashes between 7'025 and 6'500, it was likely wave 4, which would still be bullish. But we want to see it developing like this instead:
UPDATE: Seems like we are good for now. I hope that BTC will jump above 7'800 soon. Would be a nice vacation present...
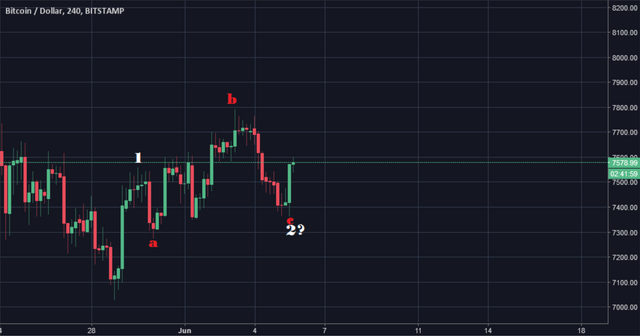
UPDATE 2: Wave 2 correction seems to not be done yet:
He will be gone for holidays starting on the 07.06.18 until 14.06.18.
@lordoftruth:
Upside Move is in progress but we believe, should be limited to 7'996 - 8'075 area and after reaching this level most likely bears will return in full swing, supported by stochastic, with its targets 7'100 - 7'210, to be followed by calm decline towards 6'519, while a panic sell below 7'000 could open the doors for price decline below 5'947 before plunging to 4'300, the potential bullish reversal location.
Todays trend is bearish. Trading between 7'050 and 7'996.
@philakonesteemit:
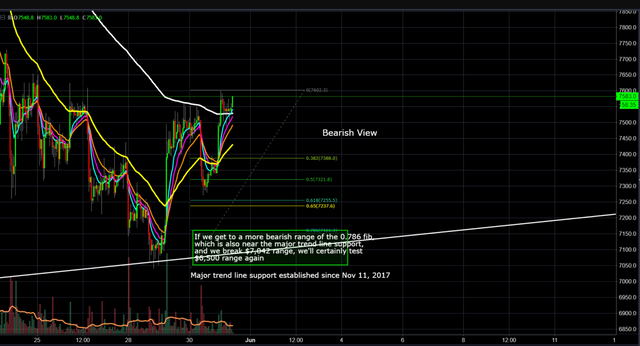
A bounce at the 7'000 level was much expected due to hitting a major trend line support established since Nov 11, 2017.
Bullish View, if we break the 7'650 range, there's a chance to hit 7'850 to 8'000 range (0.5 to 0.618 fib retracement)
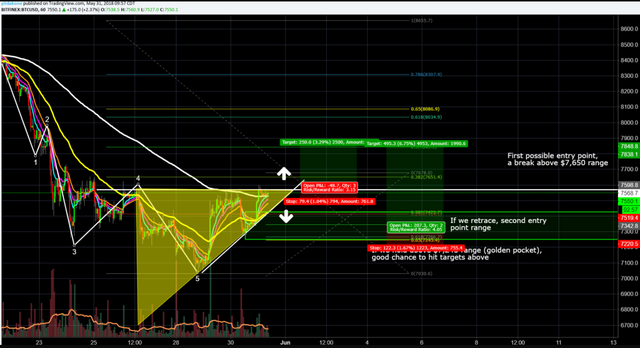
Bearish View, if we break 7'161 range, we'll most likely test 7'040, which I see as failing to hold and then testing 6'500.
@passion-ground:
BTC must hold 7'348.45 or it’s heading back down. The rally off the nearest pivot low has been weak. There is a silver lining of a bullish persuasion; however, that lining will go dark upon trade beneath 7348.25.
To confirm bullishness we need a close over 8'900.90.
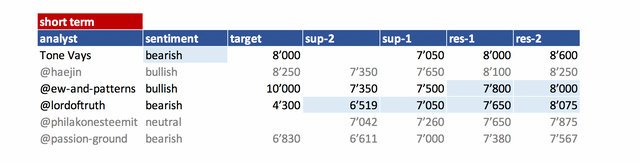
Summary of targets/support/resistance
Reference table
| analyst | latest content date | link to content for details |
|---|---|---|
| Tone Vays | 06. June | here |
| @haejin | 03. June | here |
| @ew-and-patterns | 05. June | here |
| @lordoftruth | 06. June | here |
| @philakonesteemit | 31. May | here |
| @passion-ground | 06. June | here |
Definition
- light blue highlighted = all content that changed since last update.
- sentiment = how in general the analysts see the current situation (bearish = lower prices more likely / bullish = higher prices more likely)
- target = the next (short term) price target an analysts mentions. This might be next day or in a few days. It might be that an analyst is bullish but sees a short term pull-back so giving nevertheless a lower (short term) target.
- support/res(istance) = Most significant support or resistances mentioned by the analysts. If those are breached a significant move to the upside or downside is expected.
- bottom = -> now renamed and moved to long term table. Low 2018
- low/top 2018 = what is the low or the top expected for 2018?
Further links for educational purposes:
- From @ToneVays: Learning trading
- From @philakonecrypto: Like in every post you find links to his amazing educational videos. For example here
- From @lordoftruth: Fibonacci Retracement
- From @haejin: Elliott Wave Counting Tutorial
*If you like me to add other analysts or add information please let me know in the comments.
Thanks for sharing that will affect my future decisions
I think the point is precisely to not do what the analysts say here, but to gather and crunch the info they offer, in order to come up with your own decision. Most of chartists always say, "guys don't take a trade only because I say so" :)
Nice post.
Suggest adding @luiggih to your analyst review
A nice work
Thanks for contributing to the steemit community
I followed you