Bitcoin TA - summary of analysts - 14. May 18
Regular daily update on BTC ta analysts opinions.

**My summary - short-term sentiment: bearish ** (last: bearish)

- Environment remains bearish.
- Still more downside expected by analysts. 8'300 - 7'700 is expected range after a few hours/days of recovery.
- From there we need to bounce to the upside significantly. Otherwise a risk of a longer term bear move is on the table.
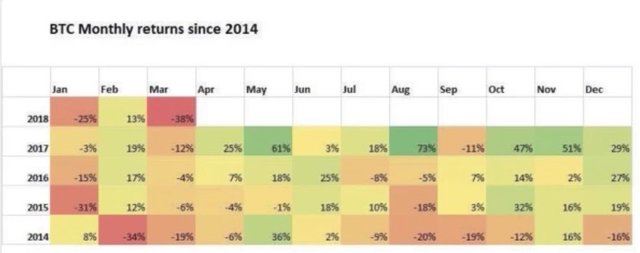
- Just realized I have been ahead of time. May is usually a strong month. Lets see how it plays out in 2018.
News about the blog
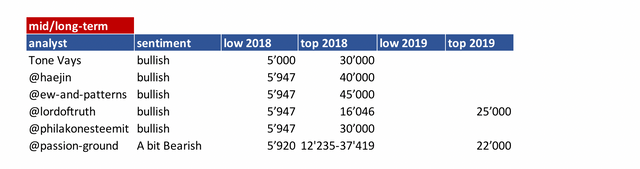
I need to revise my 2018 long term table. I need to add a 2018 and 2019 target an be more precise on the sentiment here. Will do that after I am back in Switzerland.
We lunched the bounty project beta. If you are interested and you like to create a bounty on your own have a look at this post
Analysts key statements:
Tone:
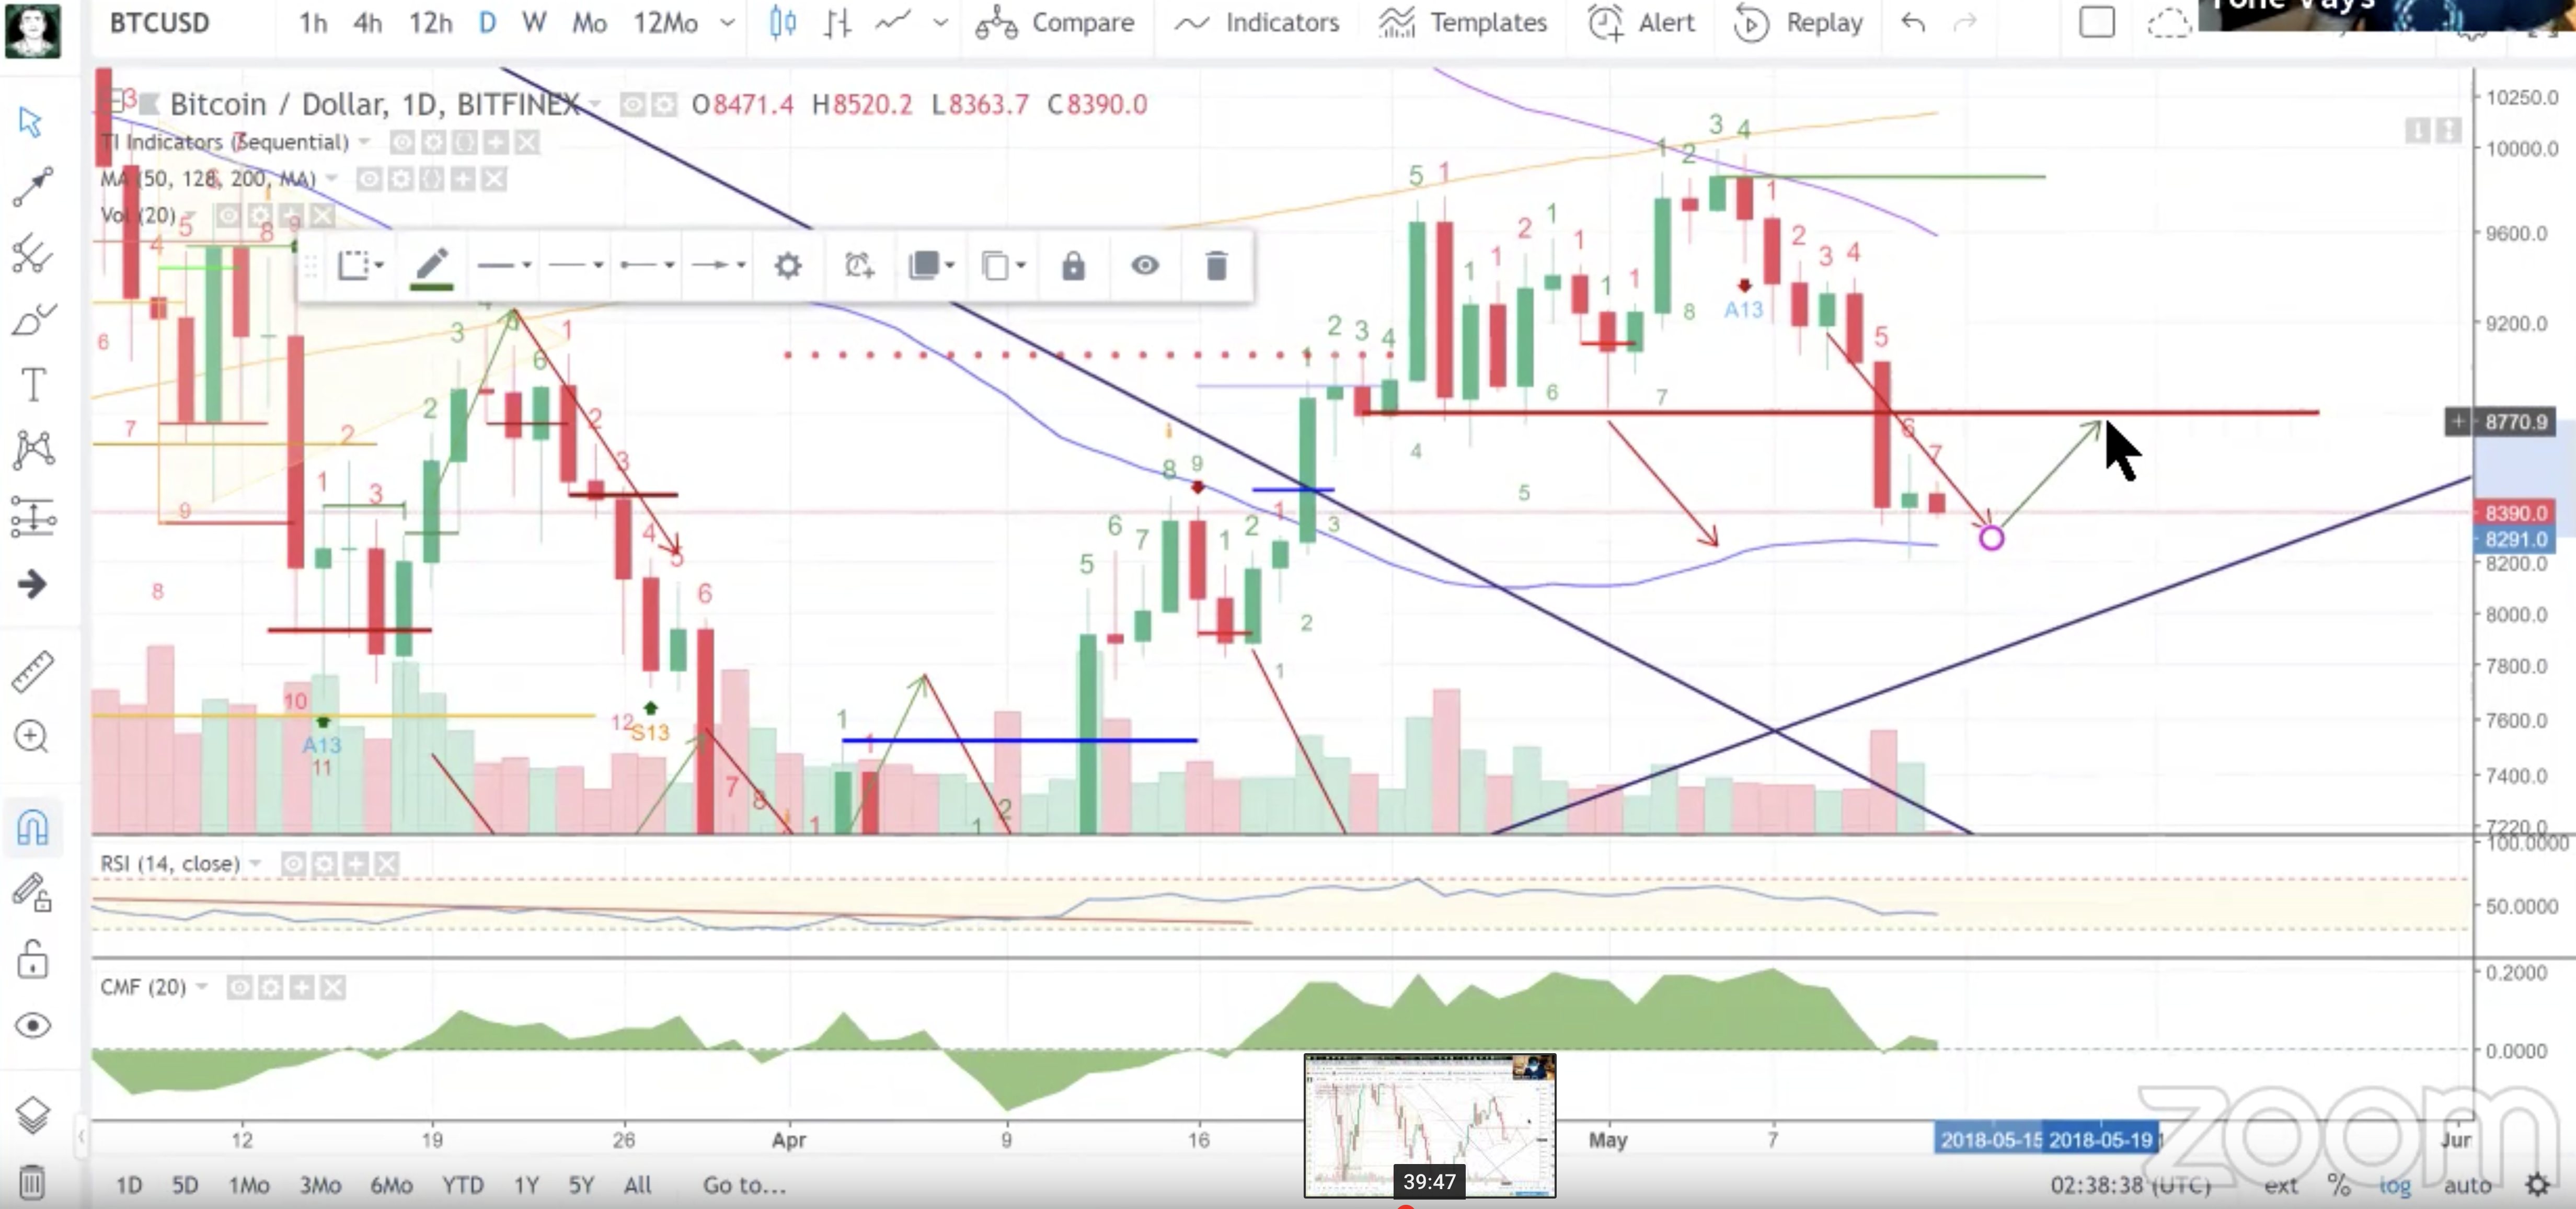
- Weekly: We are on a price flip. Any bullish momentum we had is "dead". If we get a red 2 below the red one this will be a shorting opportunity.
- Daily: On a 8 of 9. To get a 9 we need to close below 8'412. Rest remains as yesterday. He still expects a low for tomorrow followed by a 1-4 recovery and than go down further.
@haejin:
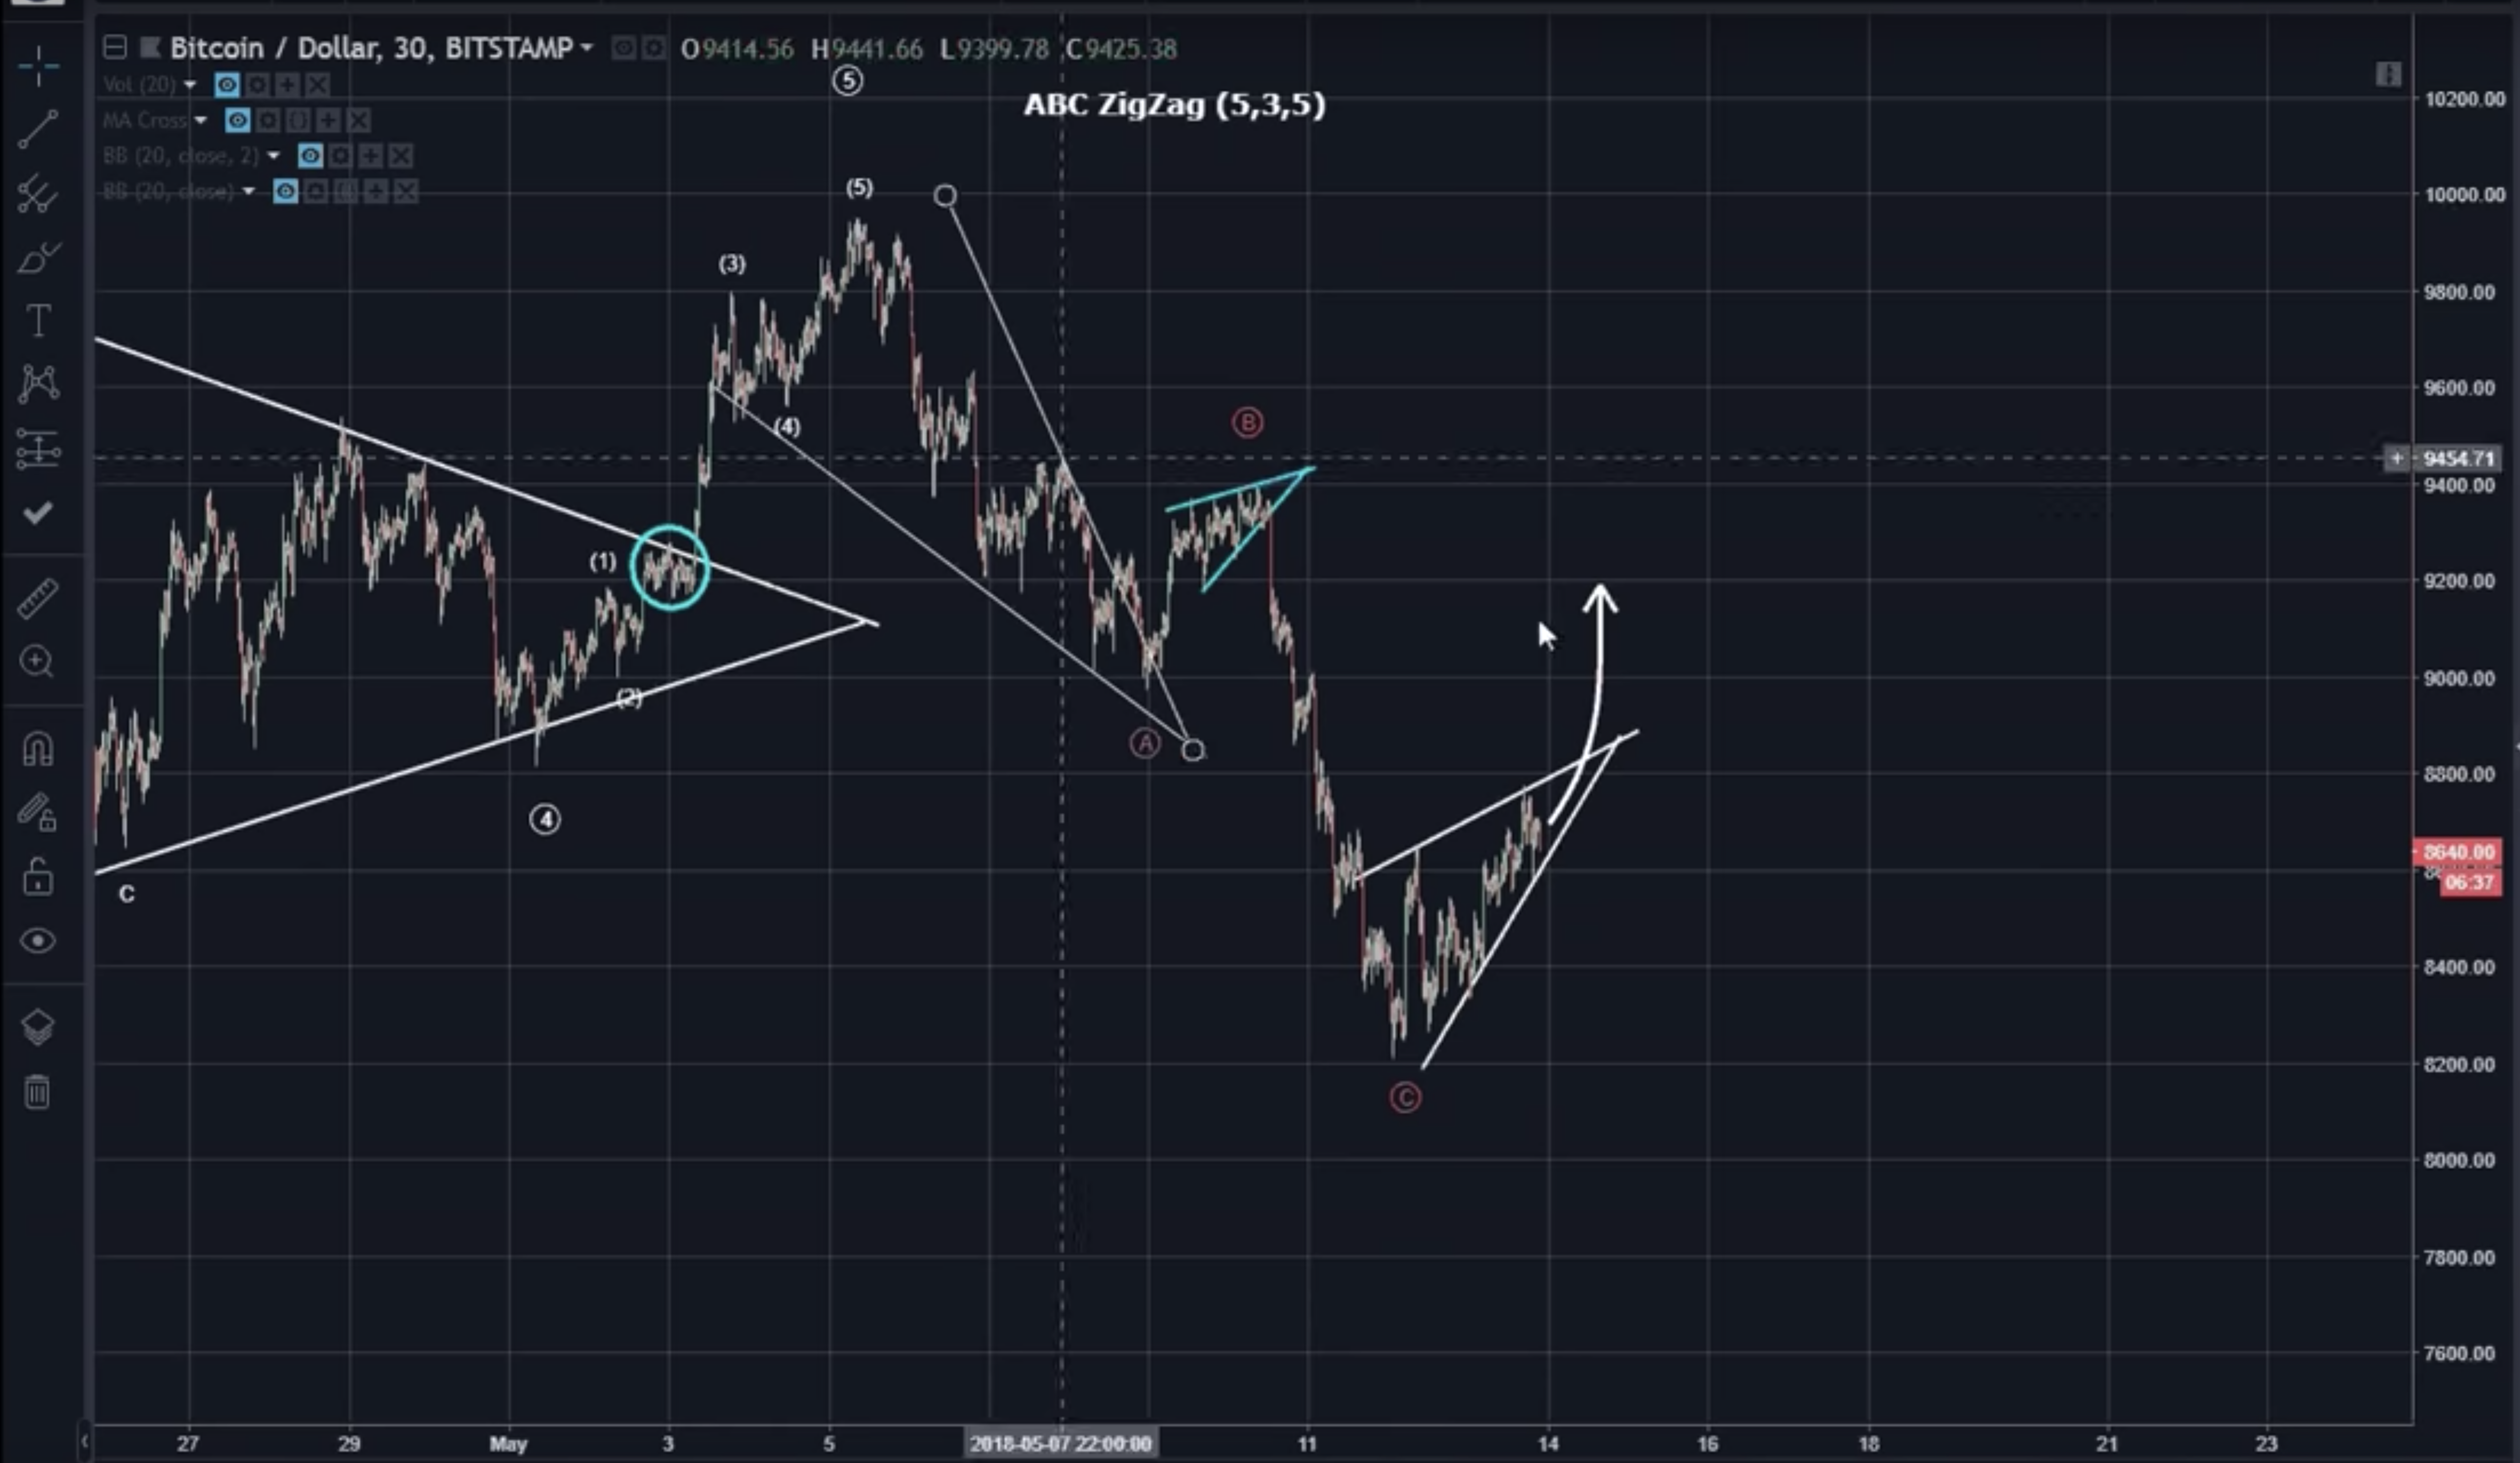
He thinks ABC is not done. At the moment we are working on an upward pointing wedge. We most likely going to break to the downside moving in 5 wave down to about 7'700.
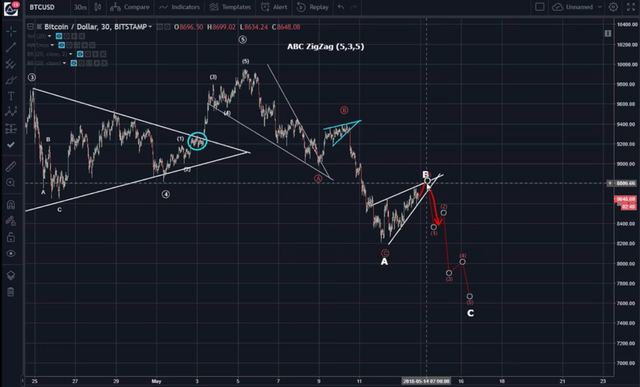
Alternate: ABC is done already. We need to break through the wedge to the upside soon.
@ew-and-patterns:
He sees the bearflag is about to be broken. If BTC drops below 8'200 next target is 7'800 and complete 5 waves of wave A. That would mean the correction is not over and could take the whole month of may, or even longer.
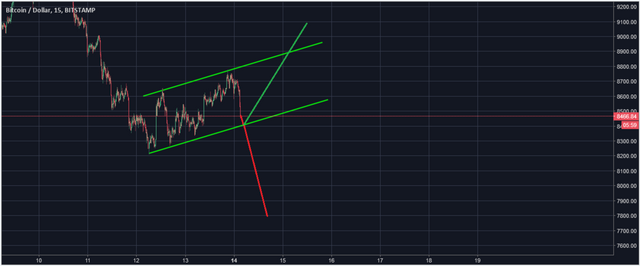
Alternate: Bouncing of the channel to the upside. Not very likely.
@lordoftruth:
Bitcoin tested the 8'643 which is to weak for a true recovery. That is why he believes that bears are eager to extend the correction.
Bearish wave for today is expected especially that stochastic shows clear overbought signals now, besides the price move below the EMA50.
He considers 7'770 a buying opportunity.
Today's trend is neutral. Trading between 7'770 and 9'050.
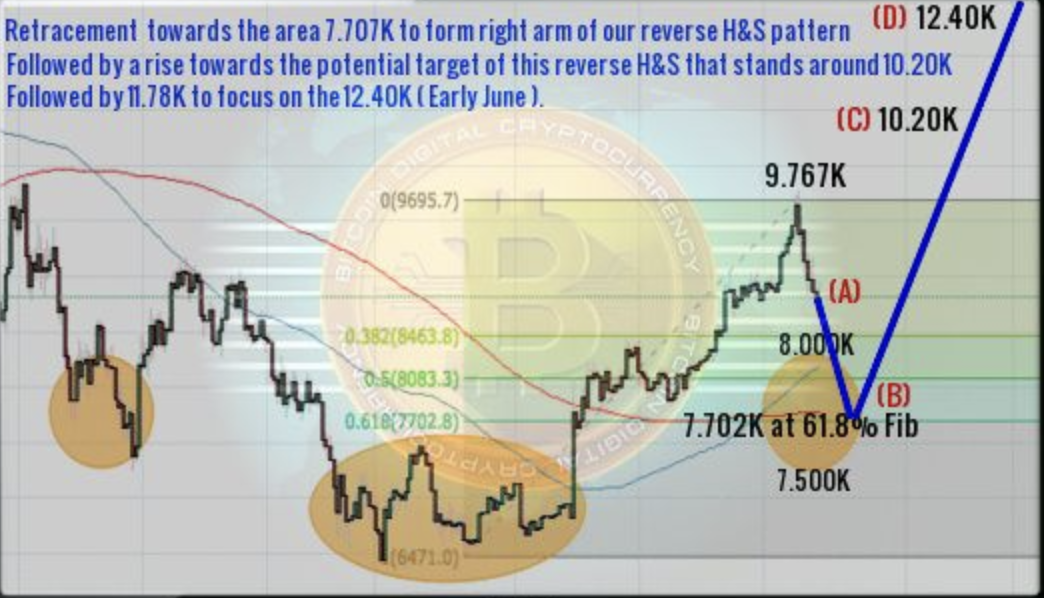
@philakonesteemit:

We see a massive rejection at 10'000 range and have now hit a 0.618 golden ratio fibonacci retracement level. I do not believe it'll hold and we can see 9'050 to 9'150 range. If that doesn't hold we go for 8'200 to 8'620 range.
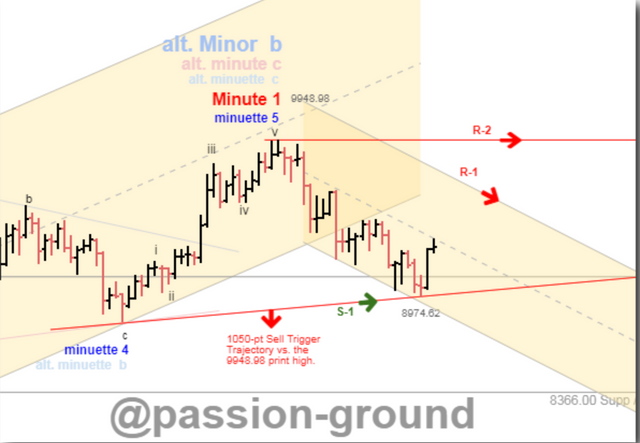
@passion-ground:

If the preferred bullish count is to remain in place, bitcoin could go down as low as 7'887, which is a 0.618 fib retracement of the entire bullish advance from lows printed on April 9th. Short-term trend is down, and the 9'577 level is “key” upside resistance. If crossed we will see a short-term move above the recent print high of 9'948. If 9'577 holds we will see further downside consolidation before next bullish run higher.
Summary of targets/support/resistance
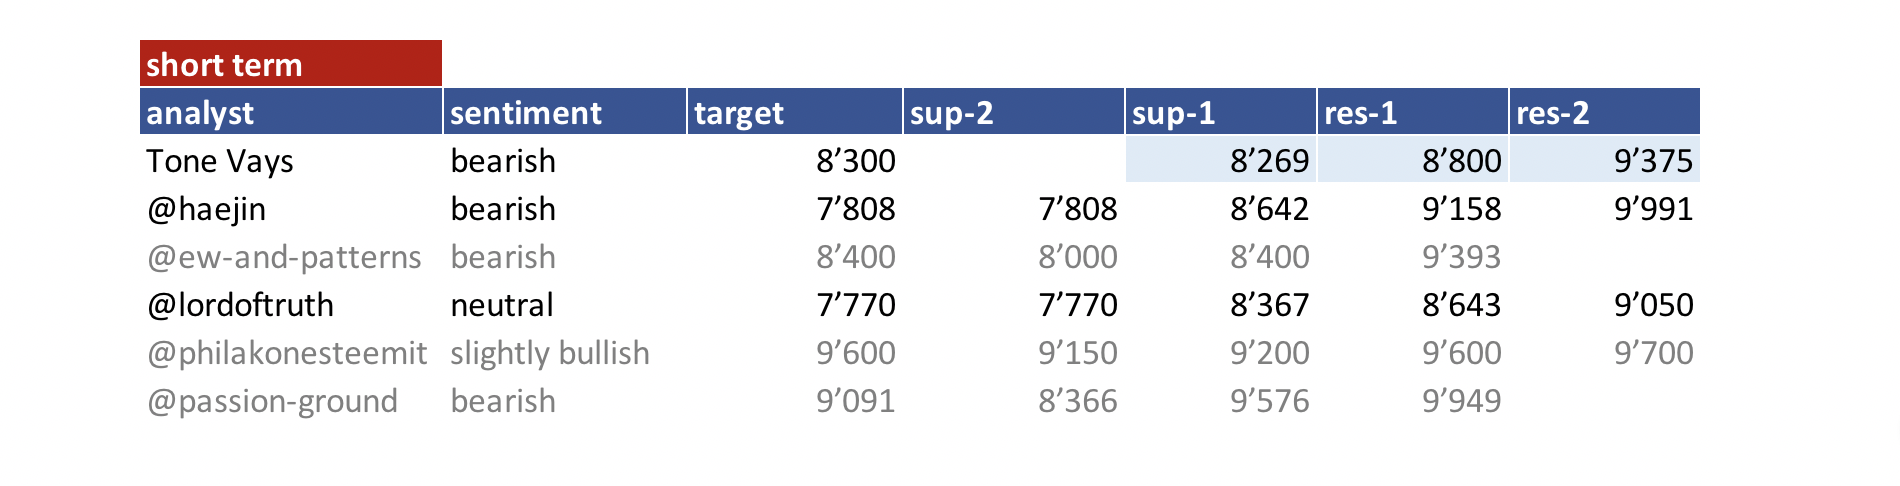
Reference table
| analyst | latest content date | link to content for details |
|---|---|---|
| Tone Vays | 14. May | here |
| @haejin | 14. May | here |
| @ew-and-patterns | 14. May | here |
| @lordoftruth | 14. May | here |
| @philakonesteemit | 07. May | here |
| @passion-ground | 10. May | here |
Definition
- light blue highlighted = all content that changed since last update.
- sentiment = how in general the analysts see the current situation (bearish = lower prices more likely / bullish = higher prices more likely)
- target = the next (short term) price target an analysts mentions. This might be next day or in a few days. It might be that an analyst is bullish but sees a short term pull-back so giving nevertheless a lower (short term) target.
- support/res(istance) = Most significant support or resistances mentioned by the analysts. If those are breached a significant move to the upside or downside is expected.
- bottom = -> now renamed and moved to long term table. Low 2018
- low/top 2018 = what is the low or the top expected for 2018?
Further links for educational purposes:
- From @ToneVays: Learning trading
- From @philakonecrypto: Like in every post you find links to his amazing educational videos. For example here
- From @lordoftruth: Fibonacci Retracement
- From @haejin: Elliott Wave Counting Tutorial
*If you like me to add other analysts or add information please let me know in the comments.
@ghayas