Bitcoin TA - summary of analysts - 15. May 18
Regular daily update on BTC ta analysts opinions.

**My summary - short-term sentiment: bearish ** (last: bearish)

- Big price move up which got stucked at 8'750.
- Still more downside expected by analysts. 8'300 - 7'700 is expected.
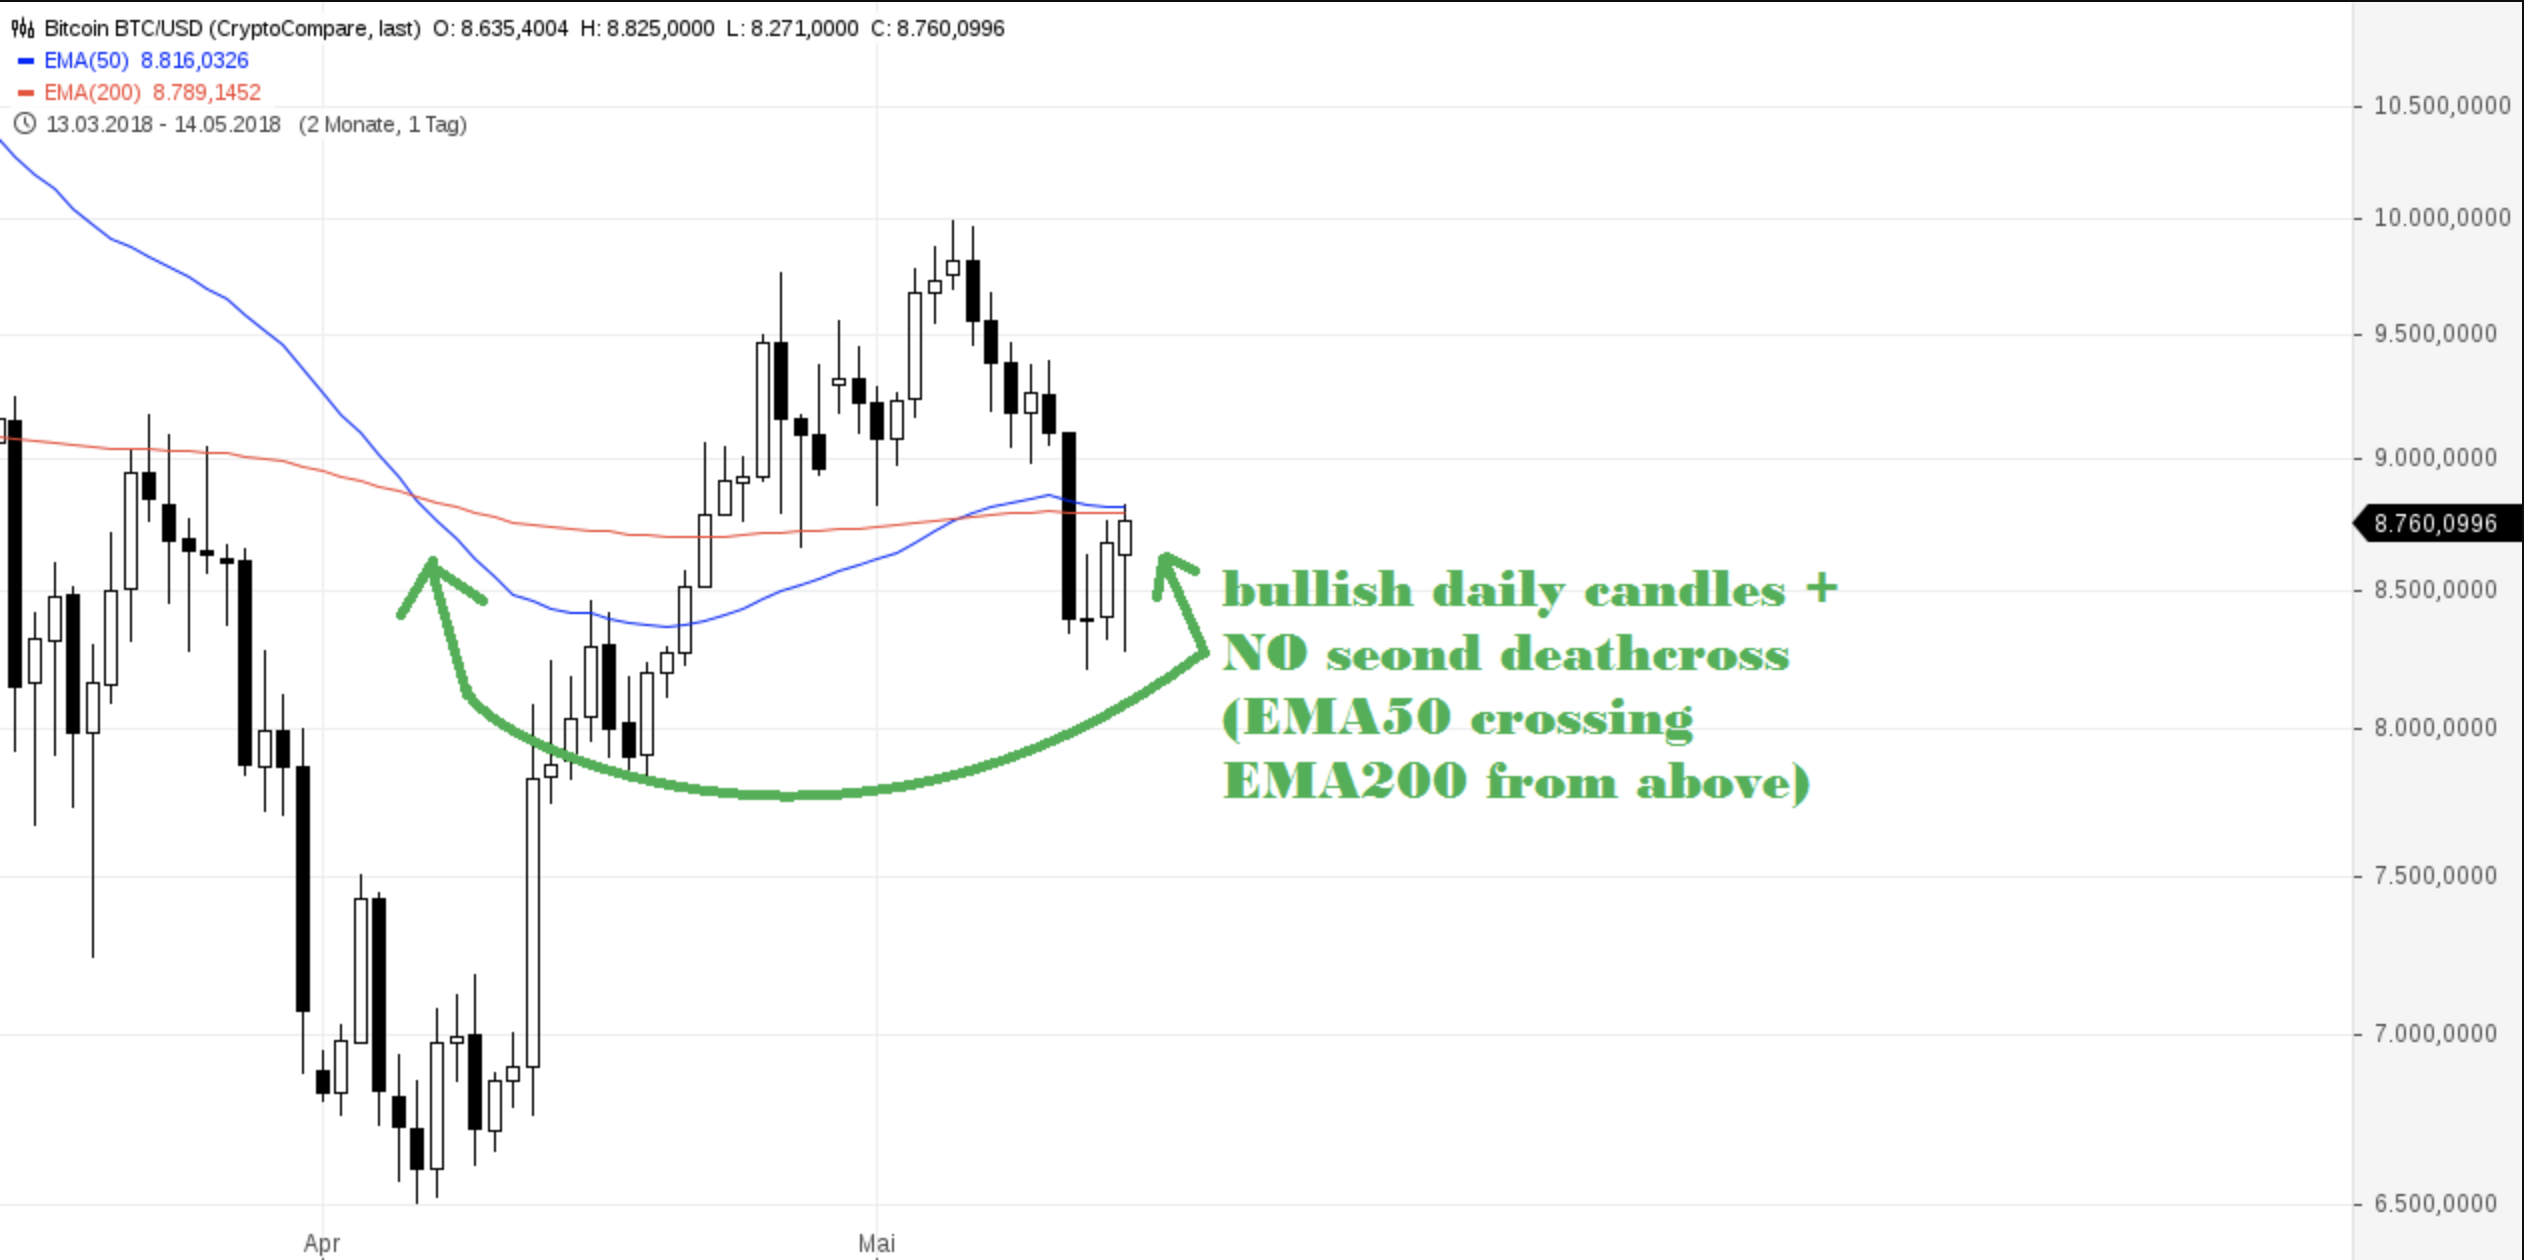
- If we break clearly above 8'800 a bullish scenarios take over.
- Just realized I have been ahead of time. May is usually a strong month. Lets see how it plays out in 2018.

News about the blog
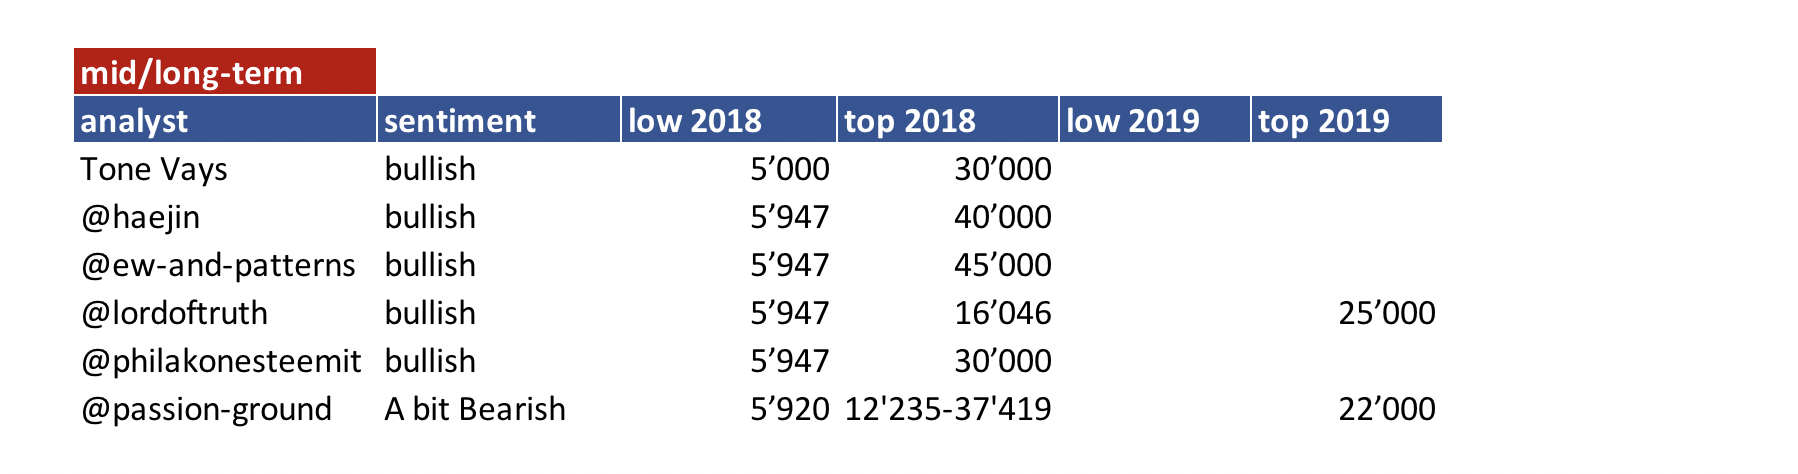
I need to revise my 2018 long term table. I need to add a 2018 and 2019 target an be more precise on the sentiment here. Will do that after I am back in Switzerland.
We lunched the bounty project beta. If you are interested and you like to create a bounty on your own have a look at this post
Analysts key statements:
Tone:
- Weekly: We have little bounce - maybe through consensus but will be short lived. Other than that weekly stay the same. We just price flipped to a red 1.
- Daily: Candle of last 12 hours was very volatile. Bounced of 50 MA. We get tomorrow a green 1 - no trade - wait and see if there is follow up buy pressure.
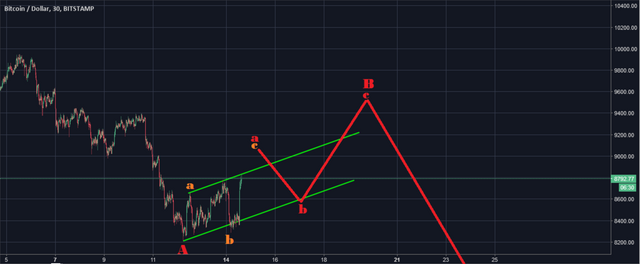
@haejin:
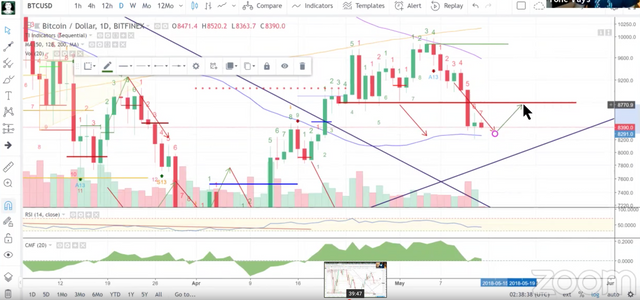
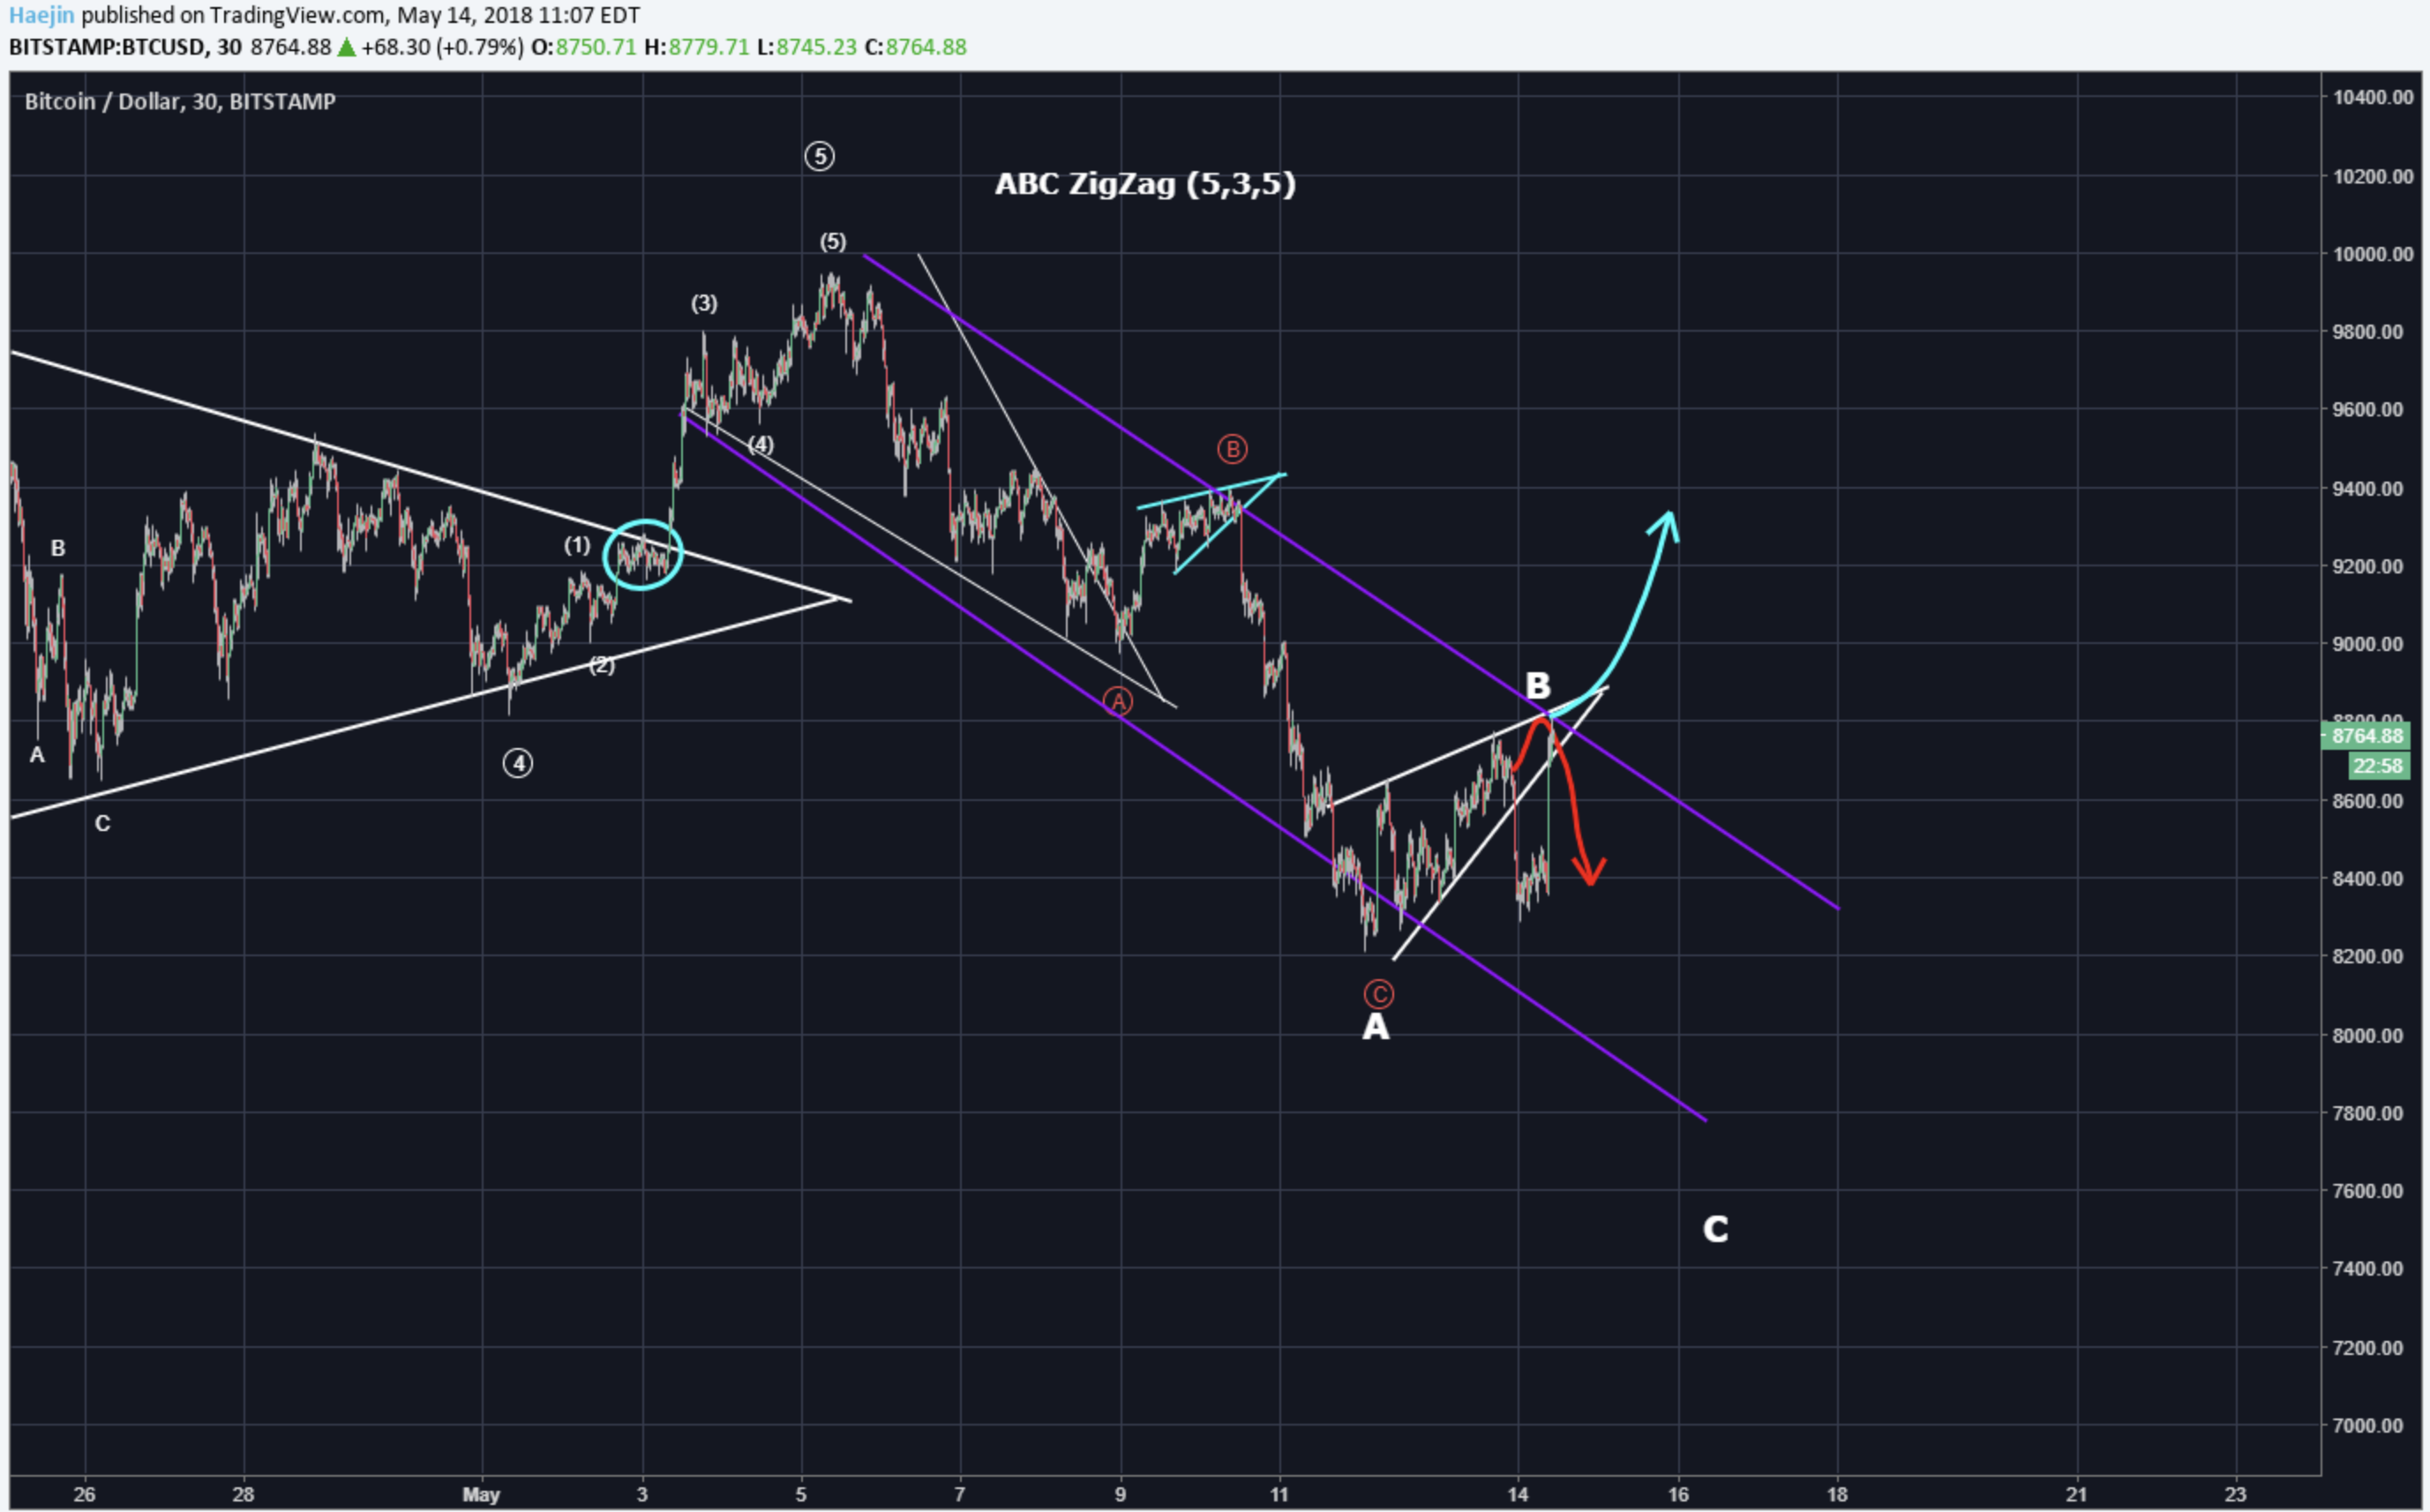
Bitcoin broke through the upward wedge and has now bounced back within the pattern. If bitcoin decisively breaches the purple trendline and the upper barrier of the white wedge it would be bullish.
However he still thinks that correction ABC is to short in time and price and further retracement is still to come.
@ew-and-patterns:
He sees two scenarios. His new main count is slightly bullish:
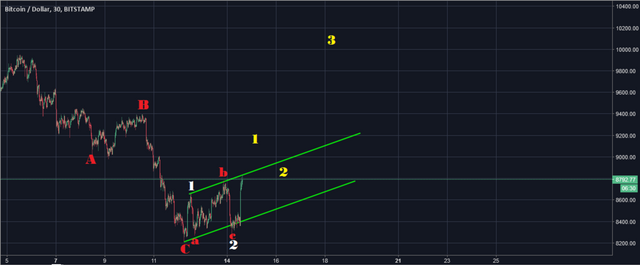
His second count - we might still be part of a bigger correction:
@lordoftruth:
Bitcoin price keeps its negative stability below 9.050K and EMA50 keeps pushing the price negatively.
Correction scenario valid therefore is still valid - target 7'770.
Price behavior around 8'643 suggests that downside action should continue to 7'770 to become a right arm of reverse H&S pattern.
Todays trend is neutral. Trading between 7'770 and 9'050.
@philakonesteemit:

We see a massive rejection at 10'000 range and have now hit a 0.618 golden ratio fibonacci retracement level. I do not believe it'll hold and we can see 9'050 to 9'150 range. If that doesn't hold we go for 8'200 to 8'620 range.
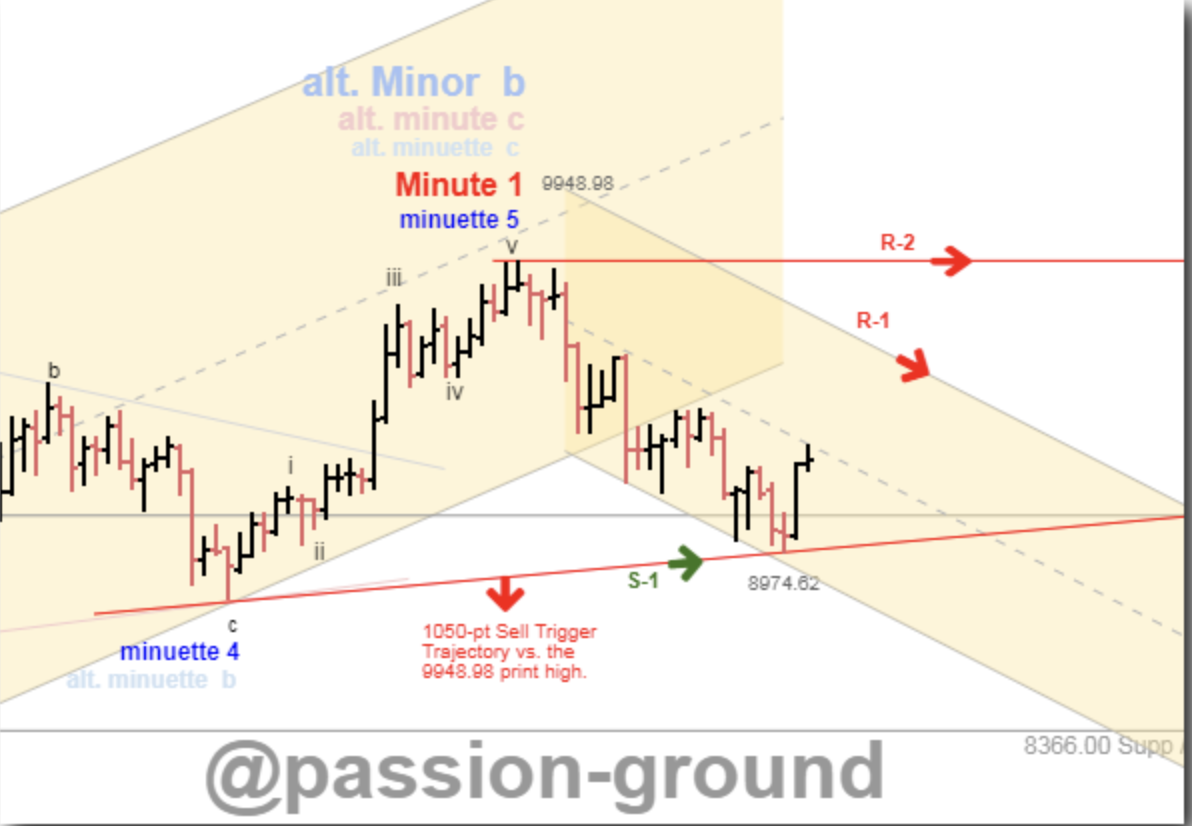
@passion-ground:

If the preferred bullish count is to remain in place, bitcoin could go down as low as 7'887, which is a 0.618 fib retracement of the entire bullish advance from lows printed on April 9th. Short-term trend is down, and the 9'577 level is “key” upside resistance. If crossed we will see a short-term move above the recent print high of 9'948. If 9'577 holds we will see further downside consolidation before next bullish run higher.
Summary of targets/support/resistance
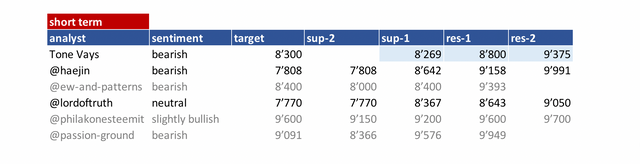
Reference table
| analyst | latest content date | link to content for details |
|---|---|---|
| Tone Vays | 15. May | here |
| @haejin | 14. May | here |
| @ew-and-patterns | 14. May | here |
| @lordoftruth | 15. May | here |
| @philakonesteemit | 07. May | here |
| @passion-ground | 10. May | here |
Definition
- light blue highlighted = all content that changed since last update.
- sentiment = how in general the analysts see the current situation (bearish = lower prices more likely / bullish = higher prices more likely)
- target = the next (short term) price target an analysts mentions. This might be next day or in a few days. It might be that an analyst is bullish but sees a short term pull-back so giving nevertheless a lower (short term) target.
- support/res(istance) = Most significant support or resistances mentioned by the analysts. If those are breached a significant move to the upside or downside is expected.
- bottom = -> now renamed and moved to long term table. Low 2018
- low/top 2018 = what is the low or the top expected for 2018?
Further links for educational purposes:
- From @ToneVays: Learning trading
- From @philakonecrypto: Like in every post you find links to his amazing educational videos. For example here
- From @lordoftruth: Fibonacci Retracement
- From @haejin: Elliott Wave Counting Tutorial
*If you like me to add other analysts or add information please let me know in the comments.
Thank you for the analysis and graphs, I will be constantly following! I won't even move my bitcoins anywhere! I believe this is the father of cryptos and next is the steem! Thanks for the share, famunger!
Very clear... but in the long run, it will rock to the moon :