Bitcoin Is Tanking Today, Here Is The Daily & Weekly Analysis (Video)
Alrighty, Bitcoin is going down and has been falling for several days so it is time to have a deeper look at the charts. In this analysis, we are going to have a look at both the daily and weekly chart. Lets begin with the daily:
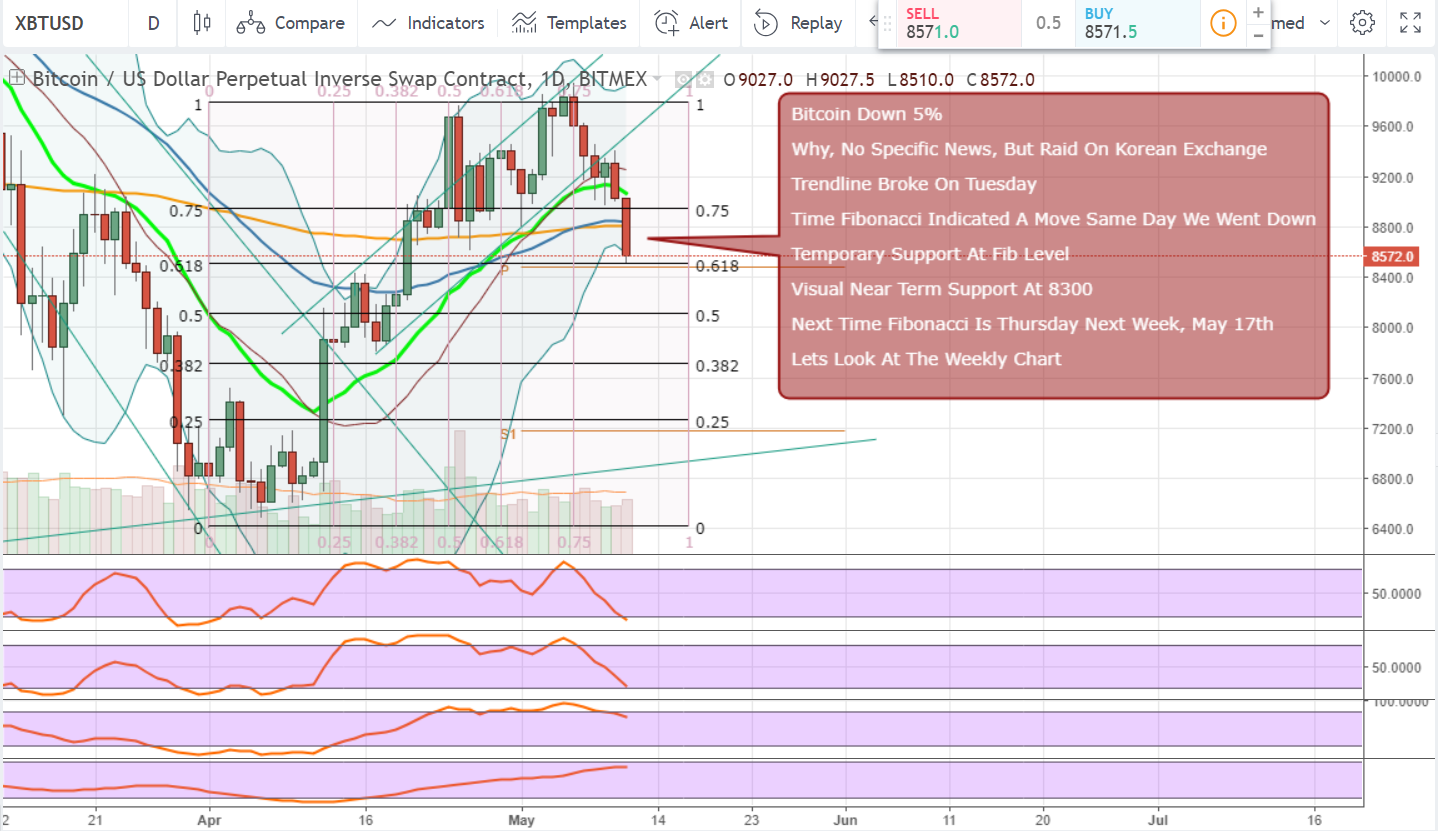
Comment: First of all, I havent seen any specific news that started this pull back so I assume that it is just profit taking in general. Otherwise, today we got some news coming out of Korea that the police have raided some exchange but the fall started on Tuesday, so we cant attribute that news to the action earlier this week.
Now, what does the daily chart tell us? Well, we can see that on Tuesday, the supporting trendline broke, we had a daily close below it and today the downward move accelerated.
At the moment we are visiting support at 8500 which is a fib level and we could potentially get a bounce from here. However, it will likely fail and then the next visual support is down at 8300.
According to the Gann Box, we could get a reversal later next week, in fact on Thursday the 17th of May.
Anyways, lets end with a look at the weekly chart as well:
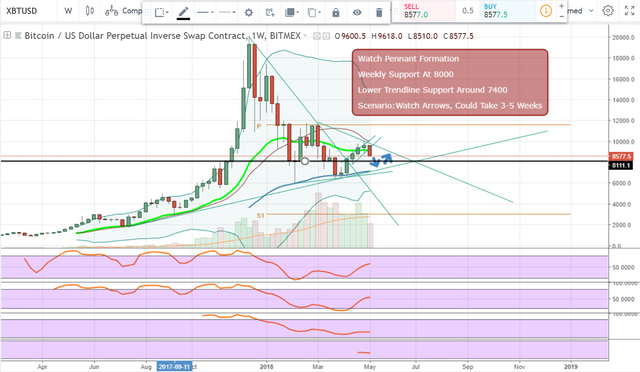
Comment: Here we can see that we have formed a new pennant formation and we might head down to 7300 before we reach the lower trendline.
If you look at the blue arrows, one scenario could be that we will go down to 7400 and then back up again to 9000 and touch the upper trendline. This total move will likely take 3-5 weeks.
Thats it for now, as always, we are dealing with probabilities and lets take one day at a time from here.
Happy trading!