BTC chart review June 16th 2018 @ 20:35PST

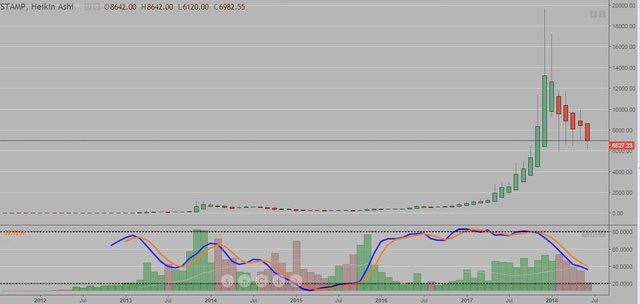
Here is the monthly chart of BTC from the Bitstamp exchange. It has produced 5 red heikin ashi bars illustrating the downtrend with no significant signs of reversal.
Stochastics appear to be starting to level off from it's steep decline which may signal a slow down to the decline.
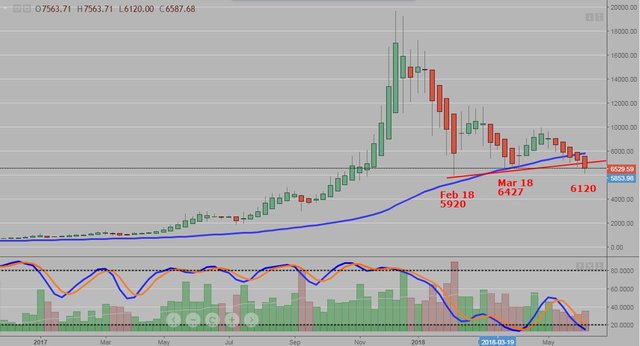
The weekly chart shows 5 red heikin ashi bars as well and it has dropped below the asending trend line from the Feb low to the March low.
It is now trading below the 50 dma (blue line)
Stochastics are oversold and may embed if both lines are under the 20 level 3 weeks in a row.
Next potential support is the Feb low.
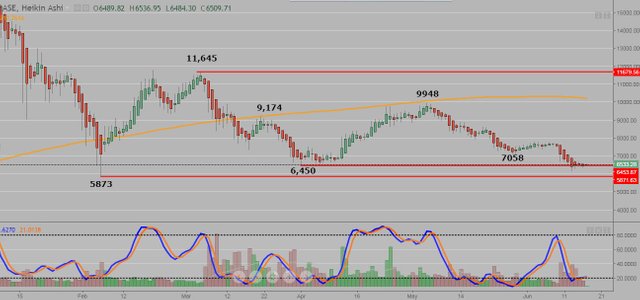
The daily chart from the Gdax exchange shows the trading range that BTC has been in since late January of this year.
Although the late March low was pierced, it is currently providing some support.
The 200 dma has provided a resistance level since March. People that follow the 'Mayer Multiple' purchase BTC when it is a certain percentage below the 200 dma as a trade based on historical numbers.
Stochastics are flat at the oversold level.
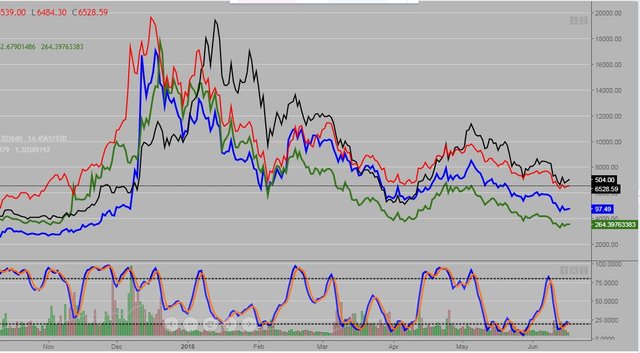
Comparing BTC in Red with the forks, Bitcoin Cash in Blue, Bitcoin Gold in Orange and Bitcoin Diamond in light blue.
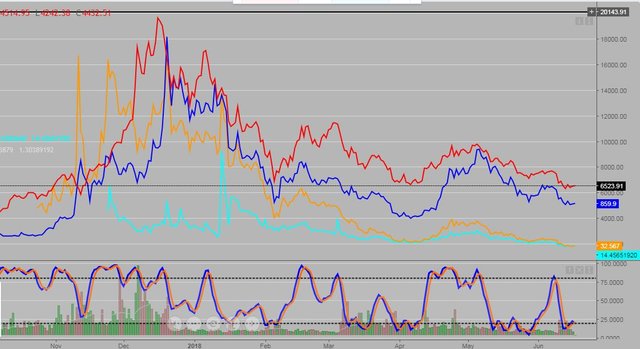
Comparing 'king' BTC in red with ETH in Black, LTC in Blue and Dash in Green. BTC has not dropped below the Feb low, but LTC and Dash has which shows their weakness in the market.
Most people are looking if BTC will hold at this level or test the Feb low which is significant. IF it drops below the Feb low, it will be technically producing lower lows for a confirmed downtrend. If that happens, you can pretty much guarentee lower prices for the short term unless it is a spike low bottom and reveral.
Although I keep checking hourly, 4hr, daily, weekly and monthly charts. I keep focusing on the daily one for the big picture and I am starting to believe we will not get out of this trading range until two or three simultaneously events create the spark for institutional money to decide it is time to jump in.
Bitcoin is a very new and different asset not comparable with anything out there right now. At present time, retail traders are eather out or holding and not participating in the market, and big whales are just waiting to decide when to enter. This is the main reason the market is not showing any clear trend.
We still need for the big move to start.
For the most part, it ran up too far too fast in 2017. So a consolidation period before the next swing up and no one knows exactly when that will happen.
Just the last few days, it has a bit of sign for recovery. Hopefully it will move back up at the second half of the year.
Bitcoin Price need very fast supplementation from Big markets. I am worried at the moment that it will not happen in this year but
It will be better after vacations.
Maybe this is the reason why Bitcoin goes down and nothing else? Just imagine what would you do if you had hundreds of millions dollars for investing only and Summer started, who want in this situation to be on the market sitting as monkey with laptop?
Coins mentioned in post:
You got a 2.73% upvote from @postpromoter courtesy of @glennolua!
Want to promote your posts too? Check out the Steem Bot Tracker website for more info. If you would like to support the development of @postpromoter and the bot tracker please vote for @yabapmatt for witness!