Analysis of the price of Ethereum (06.12.17)
The price of Ethereum remains at the key support levels in relation to the dollar and bitcoin. ETH / USD may run into a strong consumer interest above $ 455.
Basic moments
The price of ETH is mostly traded in the range above $ 455-450.
Yesterday's triangle with a current resistance of about $ 485 is intact on the hourly chart of ETH / USD (SimpleFX chart).
The pair holds the main support area around $ 455 and a 100-hour SMA.
Price Support
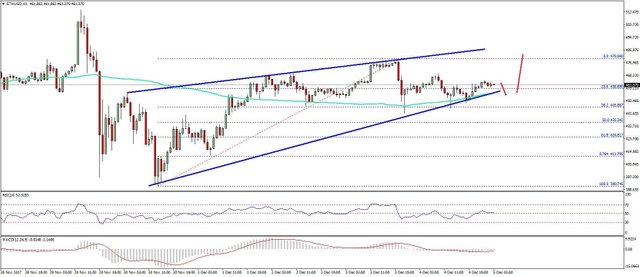
Movement of the price of ETH above the resistance of 470-472 dollars was not followed. At the same time, the downward movement was limited to support of $ 448-450 dollars. More importantly, yesterday's triangle with a current resistance of about $ 485 remains unchanged on the hourly chart of ETH / USD. The triangle support is about $ 455 and is located next to the 100-hour SMA.
The pair recently tested the Fibonacci level 38.2% of the last move up from a low of $ 390.74 to $ 479.94. The price rebounded from it and went above $ 450 and a 100-hour SMA. The price movement remains bullish while the price is above $ 455, but buyers are slowing down. They need to gain momentum and push the price above the level of 470 dollars. However, the most important resistance is the level of $ 485 and the upper trend line of the triangle. Perhaps the price will rebound from this level, but it should remain above $ 455.
If there is a break below $ 455 or a 100-hour SMA, the price can test the 50% Fibonacci of the last growth from $ 390.74 to $ 479.94. On the other hand, the initial resistance is about $ 468, followed by $ 470 and $ 485.
The MACD watch is mostly flat with a slight bullish divergence.
The Time RSI is just above level 50 and is struggling to stay above the set level.
The basic level of support is $ 455
The main resistance level is $ 485