Bitcoin (BTC) Evening Update: When in doubt, it's a TRIANGLE!!
)
SUMMARY
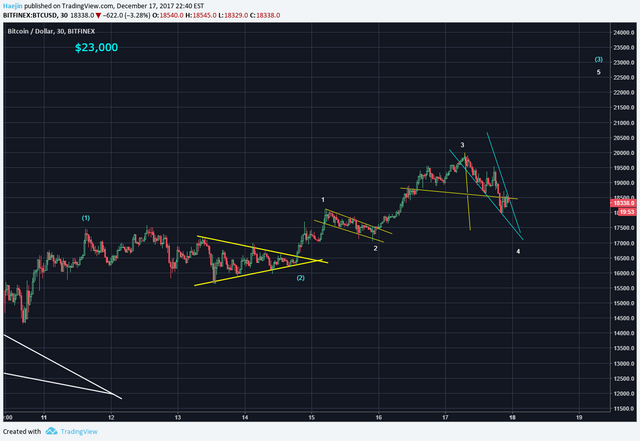
Daytime price action has been forming a wedge pattern for white wave 4. Look at all the triangle patterns....most usually, a triangle is a wave 4 or a wave 2. The same for flag patterns, they are often wave 2 or wave 4. The MACD below is reaching oversold zone and the leading indicator (white) should curl up and cross above the red lagging indicator (green circle).
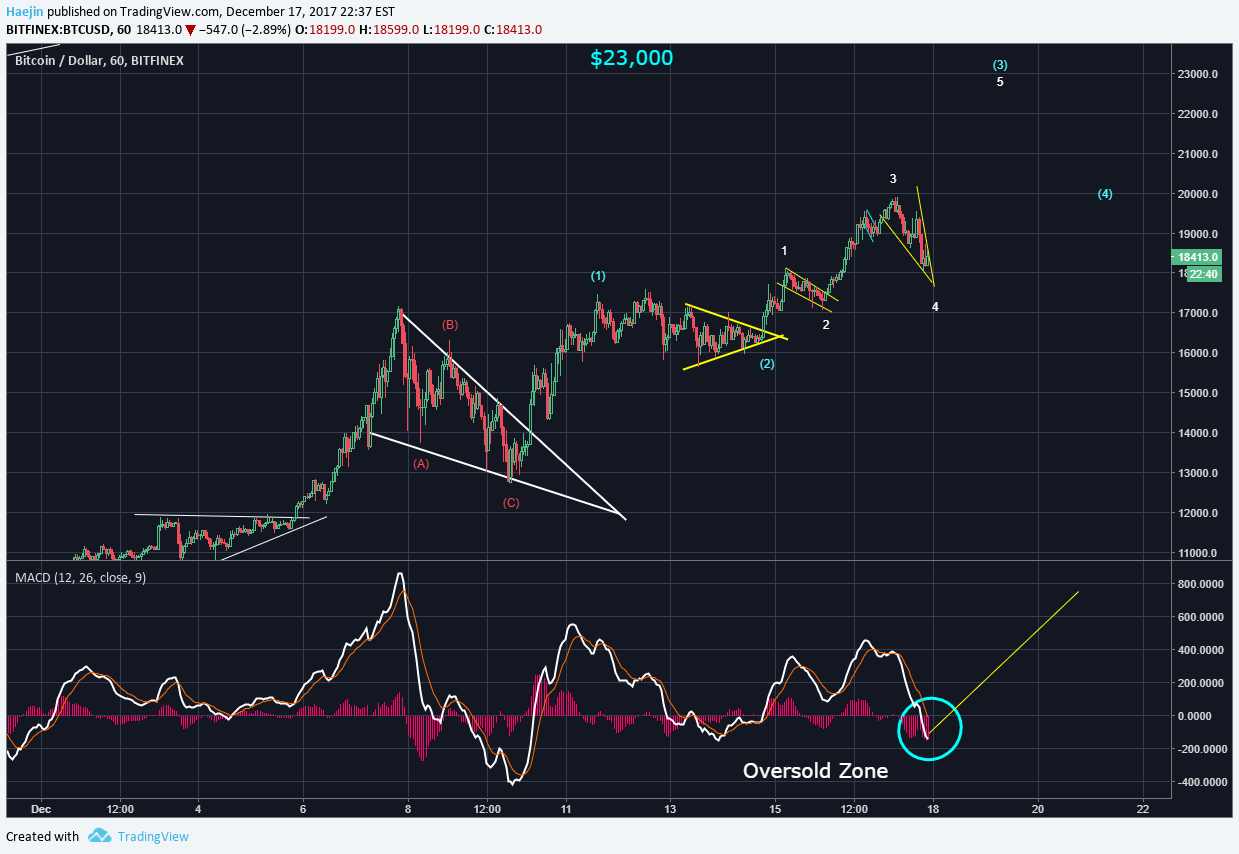
I do spot a small Head & Shoulders as shown below. However, the minimum price travel equates to the apex of the blue wedge formation. Price could meander laterally a bit as well...but I believe the $23k target is being very patient.
Please consider reviewing these Tutorials on:
Elliott Wave Counting Tutorial #1
Elliott Wave Counting Tutorial #2
Elliott Wave Counting Tutorial #3
Laddering and Buy/Sell Setups.
Laddering Example with EOS
Tutorial on the use of Fibonacci & Elliott Waves
These Technical Analysis Books: Elliott Wave Priniciple & Technical Analysis of Stock Trends are highly recommended
@haejin's Trading Nuggets
Essay: Is Technical Analysis a Quantum Event?
Follow me on Twitter for Real Time Alerts!!
--

If this blog post has entertained or helped you to profit, please follow, upvote, resteem and/or consider buying me a beer:
BTS Wallet - haejin1970
BTC Wallet - 1HMFpq4tC7a2acpjD45hCT4WqPNHXcqpof
ETH Wallet - 0x1Ab87962dD59BBfFe33819772C950F0B38554030
LTC Wallet - LecCNCzkt4vjVq2i3bgYiebmr9GbYo6FQf

Legal Mumbo Jumbo: This is only my opinion, make of it what you wish. What does this mean? It means it's not advice nor recommendation to either buy or sell anything! It's only meant for use as informative or entertainment purposes.**
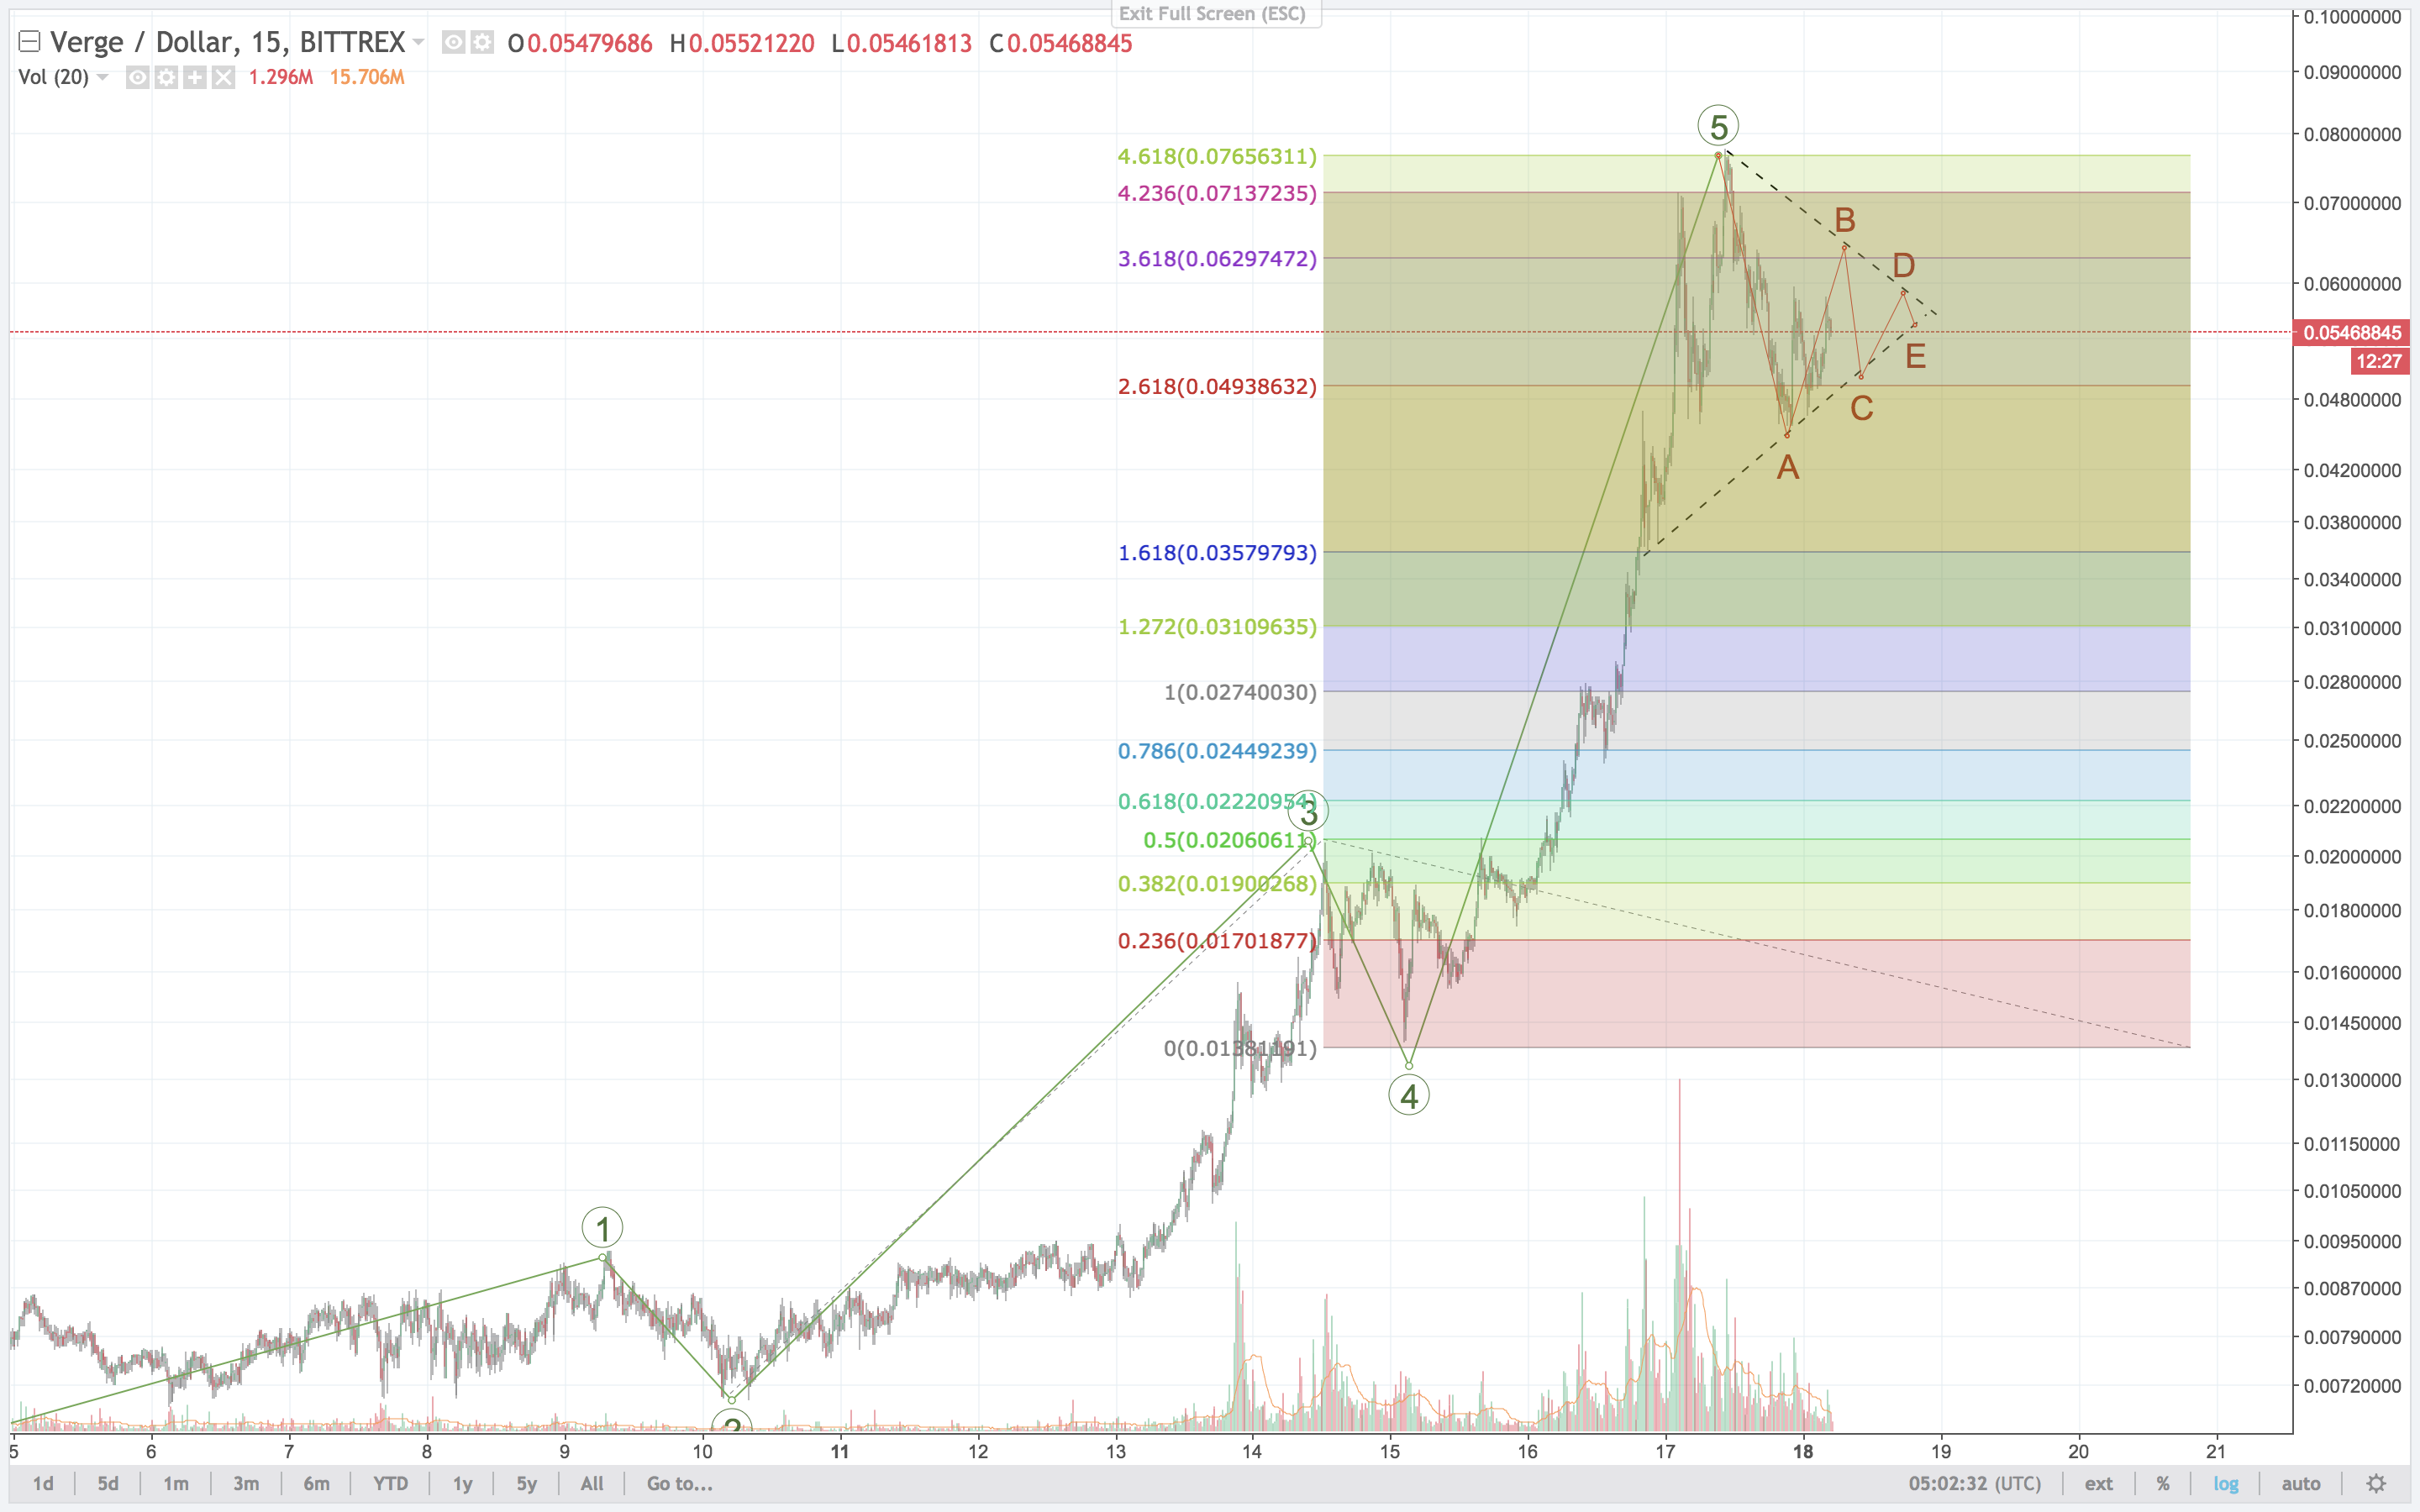
XVG 15 min
Thank you solisrex, i like the way you help out.
I think C is a bit too low here.(noob, please correct me if I'm wrong!) I don't think B ever got higher than 330 Sats.
Would you reset C at 276 sats? Or does it missing the 361 on B mean we have to re-evaluate?
Probably not, I'm assuming because we have more complete info now we can just adjust the C target to like 276 or would that be too aggressive? More like 280?
Seem reasonable to you?
Thanks from your daily newbie!
Love your work Sol.
ps Once we get to C, how do we chart D of the triangle accurately? Thanks Sol.
Thanks Haejin! Your analysis on crypto paid for my college tuition this semester and i love you for that! (nohomo) Any chance of doing a TA on $NXT/usdt pair on poloniex? I've been charting it for weeks now and it's kicking my ass.
wow! congrats
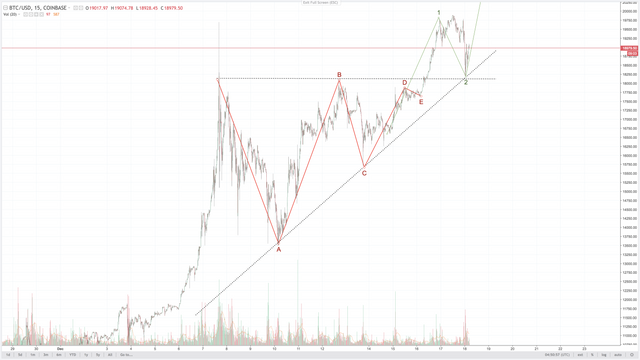
Coinbase 15 min
ADX
That's my baby about to pup..well this and ARK
Thanks Haejin!
BCH
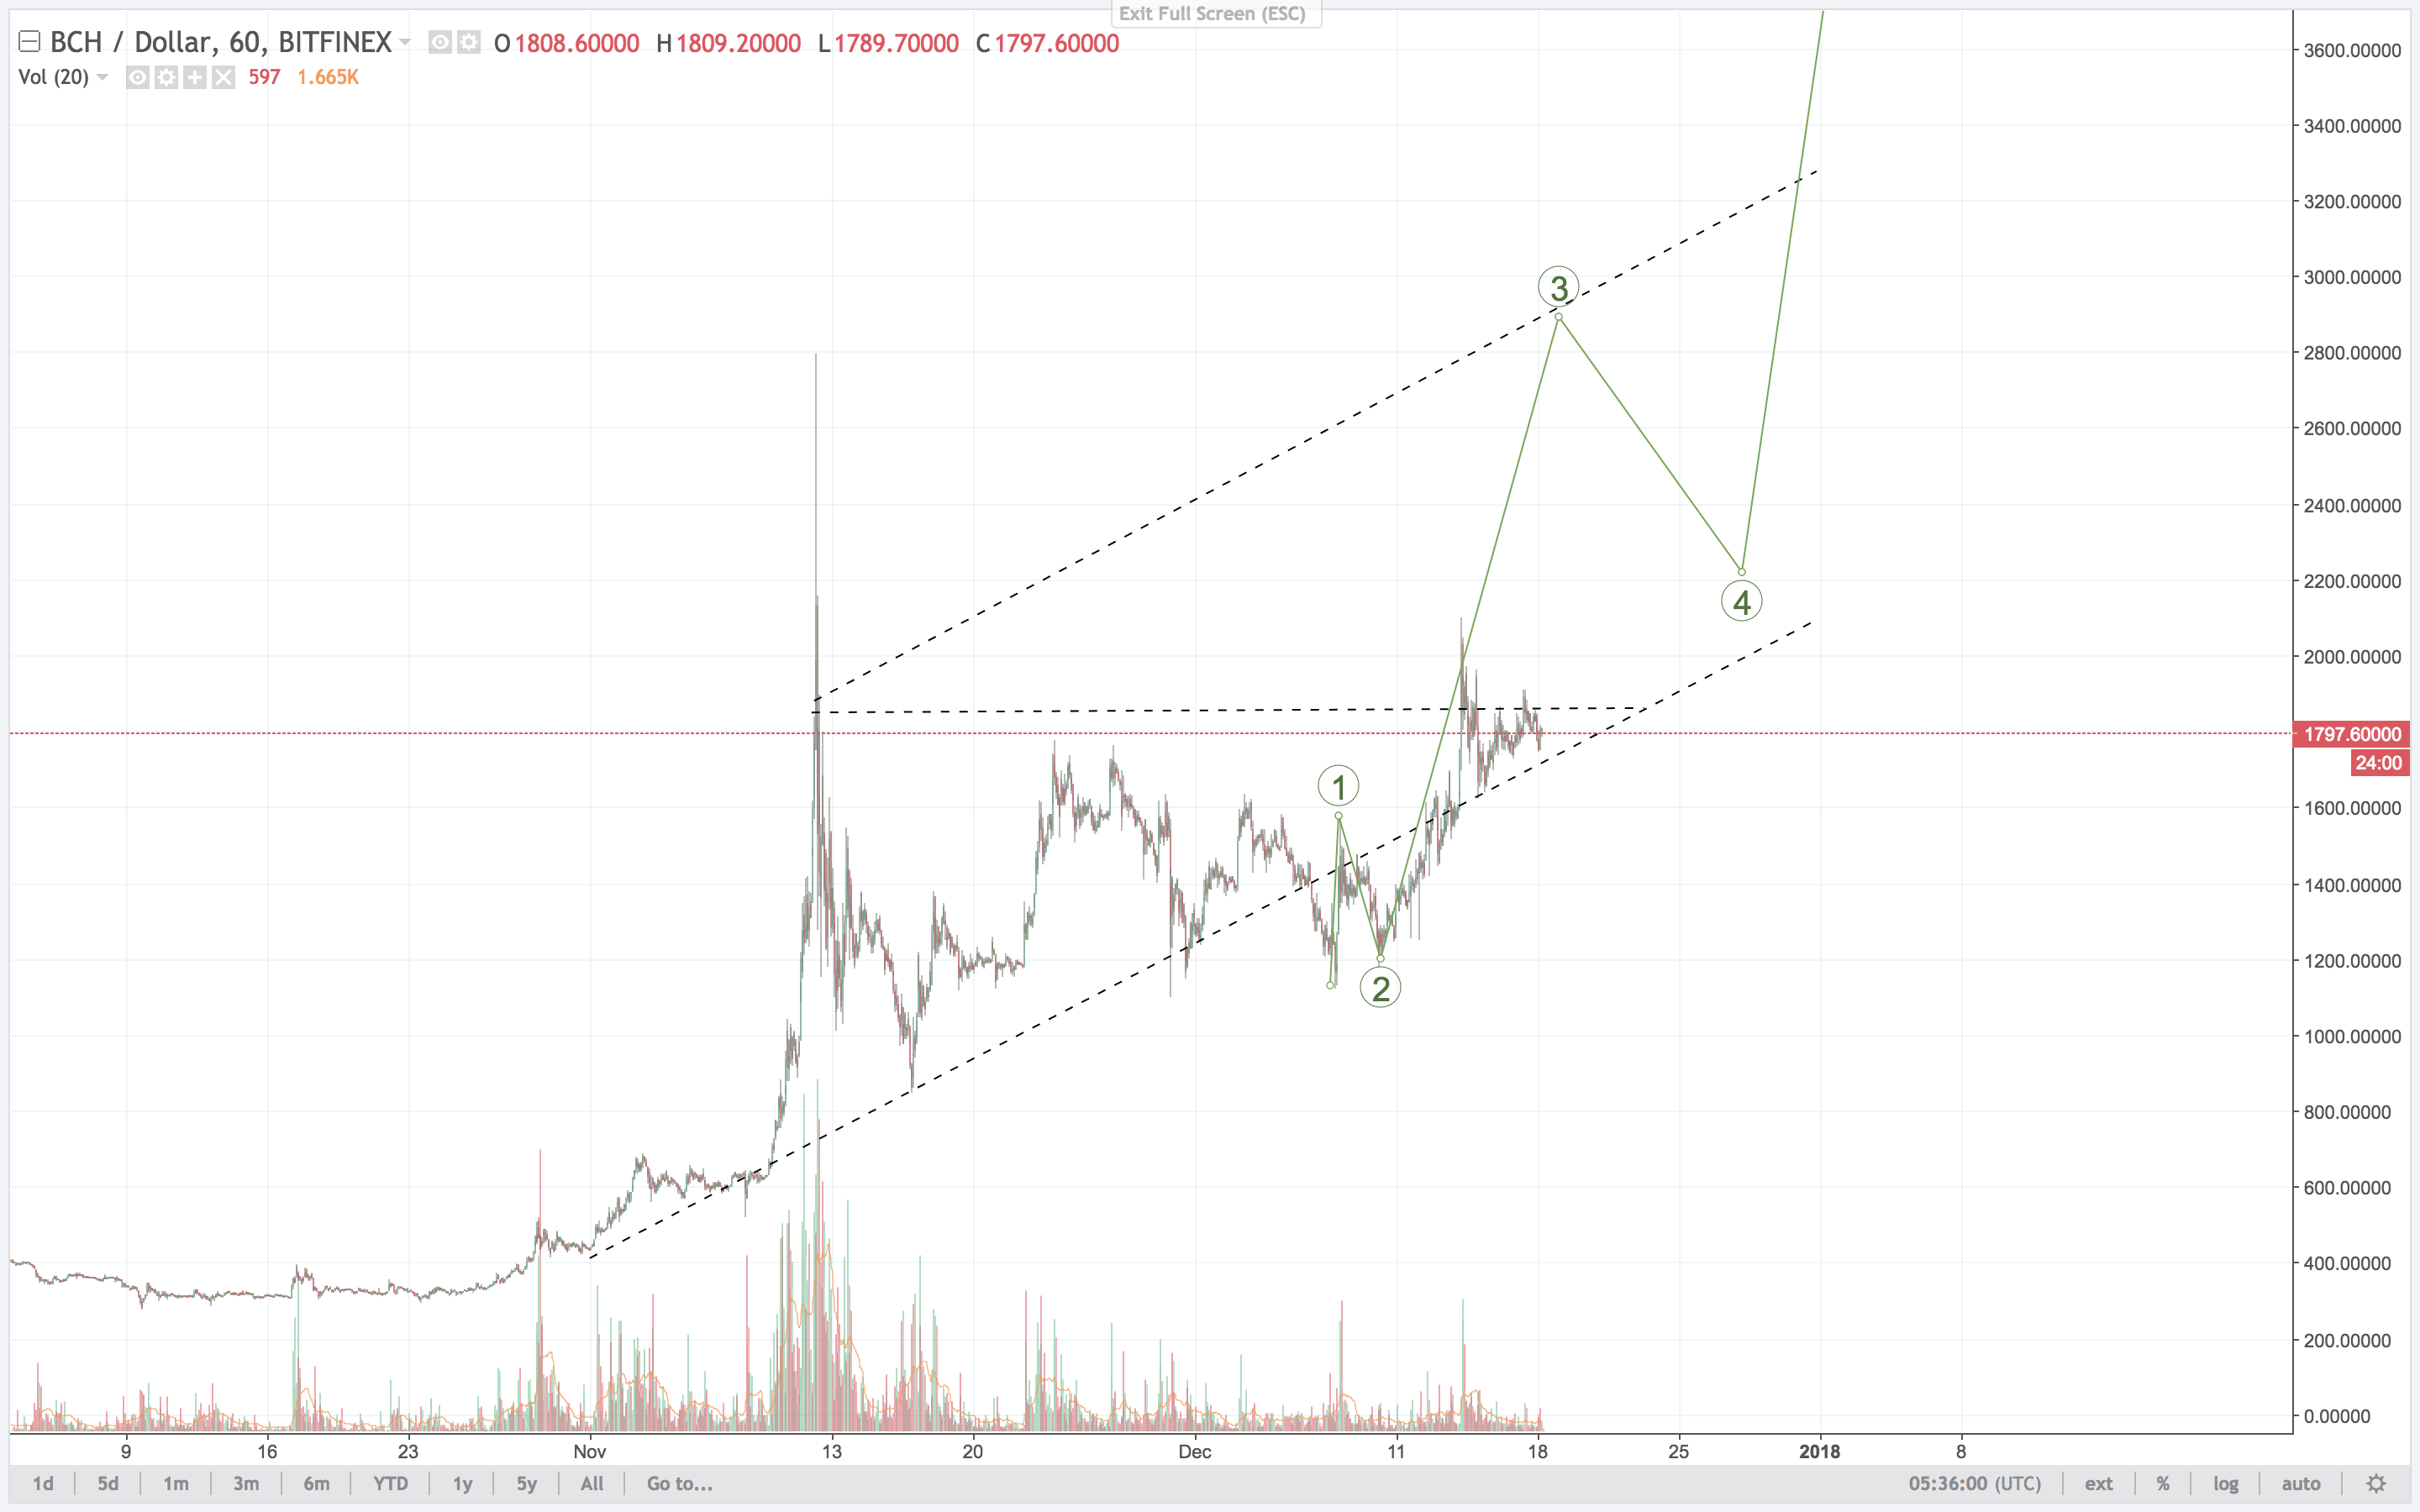
When you least expect it.
I do hope so. Please keep posting your BCH charts.
BCH finally going up!
Hello Haejin. Can you do a chart on kin token? Thanks.
I am learning so much from you haejin thanks so much. I think I found a bullish ascending triangle wedge.https://www.tradingview.com/chart/XBTUSD/NVquo3UJ-BTC-consolidating-then-going-UP/
https://www.tradingview.com/x/SRpInN2d/
Keep being patient bitcoin. Give the alts a chance to dance!
Thanks, Haejin! You're an inspiration.