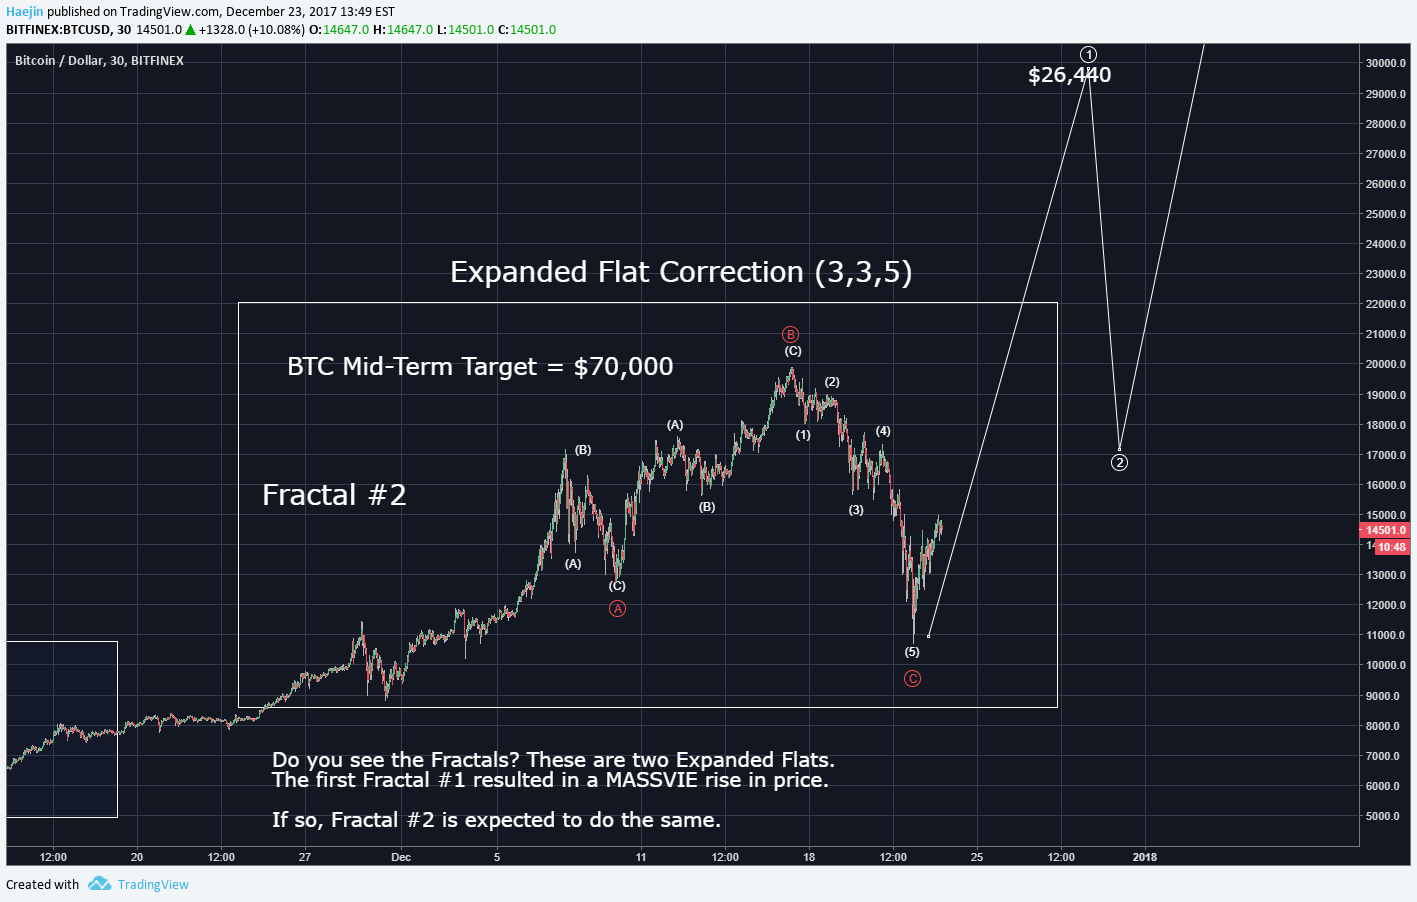
Bitcoin (BTC) Mid-Day Update: BOTTOM COULD BE DONE!!! $26,440 Short Term Target!!
)
SUMMARY
The below chart shows an updated Elliott Wave count. Note the five subwaves of red wave C. It's subwaves could be adjusted to count five as being complete. IF so, then the bottom could be in; however, we would need price to make higher higghs and exceed the bottom of subwave (3). This would allow the a confirmation of the bottom of Wave C.
Please consider reviewing these Tutorials on:
Elliott Wave Counting Tutorial #1
Elliott Wave Counting Tutorial #2
Elliott Wave Counting Tutorial #3
Laddering and Buy/Sell Setups.
Laddering Example with EOS
Tutorial on the use of Fibonacci & Elliott Waves
These Technical Analysis Books: Elliott Wave Priniciple & Technical Analysis of Stock Trends are highly recommended
@haejin's Trading Nuggets
Essay: Is Technical Analysis a Quantum Event?
Follow me on Twitter for Real Time Alerts!!
--

If this blog post has entertained or helped you to profit, please follow, upvote, resteem and/or consider buying me a beer:
BTS Wallet - haejin1970
BTC Wallet - 1HMFpq4tC7a2acpjD45hCT4WqPNHXcqpof
ETH Wallet - 0x1Ab87962dD59BBfFe33819772C950F0B38554030
LTC Wallet - LecCNCzkt4vjVq2i3bgYiebmr9GbYo6FQf

Legal Mumbo Jumbo: This is only my opinion, make of it what you wish. What does this mean? It means it's not advice nor recommendation to either buy or sell anything! It's only meant for use as informative or entertainment purposes.**
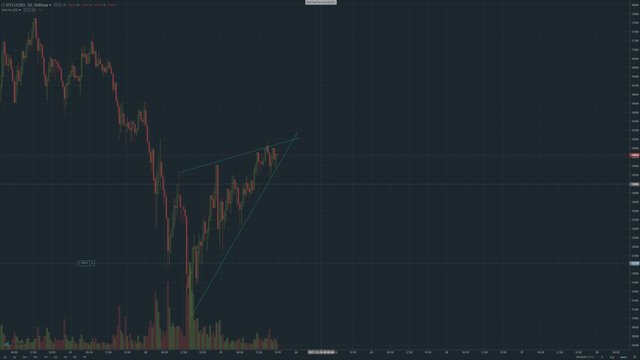
Whats about this? is this a rising wedge, isnt it? this should be a bearish indicator, right?
So that happened!
Good call on the rising wedge @z0rn
It's not looking good for the bulls
I think by now ...it's obvious correction was not done. What are your thoughts? Even though this can happen I set my ladders between 11k-9k.
8k
I can see it hitting 11k in the next 2 days.
You right read! Read more here.
Organise a TAF guys alliance, A list of people in Technical analysis of crypto currencies, if you interested!!
You are Upvoted!
I believe this is the correct interpretation. If you combine the chart with the 1 hour MACD across virtually every coin, you can see signs of bullish exhaustion, and some kind of a downward move seems imminent
Agreed. The MACD on LTC ETH and BTC is indicating a down spurt. Not sure how low but at least a dip from where it is at.
Yes. The upward move that some called 'vigorous,' wasn't at all, it became weaker and weaker.
We may see the 8000 yet. Silent night everybody !
Even though @haejin doesn't think so, I believe the H&S still can't be ruled out, especially in light of the rising wedge:
it sgoing to be a rough few days, try not to make mad moves that you will regret. If unsure.... do nothing at all is the best advice i have heard.
People are selling for christmas presents, the whales buy cars, boats, houses, have mistresses to wine and dine. It can take alot of Bitcoin. There is a lot of investment coming in January, sit tight and get prepared cause 2018 is going to be bigger than 2017.
Verge could hit $5 easily.
People dont learn, within a week they will be as crazy as ever, probably higher highs, use this time to plan for the next correction.
Main thing i learnt this time was, there are warning signs, but you need to take notice, once that whale dumped his Bitcoin and put in down to 7k that was a red flag. You live and learn.
Very nicely observed ;)
BTC just started dropping again.
The head is supposed to have the largest volume.
I know @haejin said that, but that's not the understanding I have, nor what http://stockcharts.com/school/doku.php?id=chart_school:chart_analysis:chart_patterns:head_and_shoulders_top_reversal says either.
The head has lower volume then each of the shoulders.
Volume does not really matter that much in my opinion when the market is not liquid enough because there is 200.000+ transactions sitting in the mempool. 60% of Bitcoin adresses are unusable due to high fees. This is when you have to look at the fundamentals and other factors than just TA. As well as how other coins are acting compared to BTC. I'm very bearish on Bitcoin short term and long term and my current target after this dead cat bounce is 8.000... for now.
I think TA predicts the current situation, but I guess it's just how you interpenetrate the data. I think the volume pattern is bang on so far for a H&S.
I want to see increasing volume now as the right shoulder drops. If that happens, I'm seeing 6k over the next week or 2.
The 'interpenetrate' is genius level ;)
Increasing volume right now sure won't be coming from MY side...
Seems we didn't get an evening update this time ?
Yeah!
There have been fractal bear shapes everywhere! And we just broke out of the latest one
And we're just forming another tiny head and shoulders within the right shoulder, 10k are surely ours, probably less, or more - whichever way one looks at it ;)
Wow, neighbor's dogs are barking like mad, they just got their presents ;))
That stupid haters of @haejin has down voted me.. Please help me to get back reputation so that we all need to teach lesson for haters and selfish people in this community
I hope so. I saw the same thing. I miss the initial big drop while I was working. Was going to buy in around 13 last night but thought we were in for another wave 5 drop.
And this rising wedge is a pattern of consolidation of the downtrend. But with bitcoin nobady knows
That is true. I've seen BTC break up from rising wedges in the past! haha
Yes, I had been looking at that triangle for many hours, and it finally broke out downwards...
the entire tendency had been upwards, but with ever weaker and lower highs and higher lows...
Hope is a bitch, and now we know ;))
You are our SANTA
I might start creating a bunch of gifs myself, this seems to be very profitable!
Okay, here's one but it will take time to attach haejin's head to it and in this state it's entirely unrelated to this thread - apart from the fact that "what we do is brainy" ;)

I hope so
Your last EW pattern was DEAD ON, you said we were due for impulse five which would send us lower. Now I would say $25K is a good target zone for the next major rally :-D That is exactly what I told my roommate yesterday too.
You guys should really think about making your own analysis, that's what haejin always says. If you follow blindly what he says you'll take win with him but also "losses" ... 100% accuracy is just mathematically opposed to a probability system. Anyway next time ladder when the end could have been reached until it's done.
I do my own TA all the time man. I use different tools and techniques but our conclusions normally overlap. This man has a special talent- FOR MAKING MONEY :-D
his last EW pattern says 1 more down is due.... i was waiting with my buy ladders ... crap !
It wont go down and current price is the price to ladder then? Please help!
if you think it wont go down... then whats the point with ladder !!!
Ladders are free.
If you laddered, you did the right thing and should not have lost any money. If price is on route to $26k all of us will profit. so Win win pretty much :)
"It's always better to be out of the market wishing you were in it than in the market wishing you were out of it. Never forget this."
-Haejin
I know that feeling very well and have often wished to get out (and frequently got out asap) - FOMO is now a lesser power in my mind.
But it's still there...
I shifted money in and out of bitcoin about five times already today, and so far I always made slight profits but that's not why I'm doing it - I'm doing it to stay on the safe side ;)
Man i am glad I️ found your page and started following you.
I just started following you recently. I am brand new to crypto.. but i am so exited and i see good things happening soon!
I am so happy i found you! you are brilliant! How long do you think it will take for btc to hit 25k?
Not this year ;)
My plan was waiting till next year anyway.. my goal was to get my inicial $300 hit $500 to cash the extra 200 out and leave the $300 to grow again.. but maybe it would be best to set a higher goal ? haha :)
Well... just my take, I'm into this since two months... apart from a coin making a big gain and expecting that to happen (which would basically be hodling) - if you are online a lot, at a good trading place that really works, you can easily make 10% plus a week - by staying out of danger all he time and only taking safe bets. Like, when Haejin is really sure about something, and two other TAs as well, plus you see it's plausible, then you go for it... that is, if coins are trading the way bitcoin is now, making hardly any gains and just rising and falling a bit all the time. nothing exotic, just the daily highs and lows... you want coins that are rather static for this, like one is in a triangle and everybody is waiting and waiting for it to break out, this is your time.
Now it's at 14200, then at 14800, then at 14500, then 15100, then 14800 again... you will have 1100 dollars for the thousand you stared with but you have to be alert, and bugger out for the night, change your coins into fiat so nothing an happen. Sothat you can have a life and get some sleep ;)
You would have 1400 dollars after one month, 1960 after two, and so on... this is what day traders do. The catch is that with money in the lower hundreds, the cost is relatively high, a buy and sell can cost a few dollars, so you would only be able to trade when the gain is above that amount... but that doesn't matter because you need some practice., you'll learn how to handle this after a few weeks of actual trading. Now to do that, and learn from mistakes, using just a few hundred is of course ideal. If you start now, you might be able to start in earnest in February, and maybe have a thousand bucks to act with till then ;) I went in and out of bitcoin five times today while it was more or less going sideways (slightly up, could as well have been slightly down), and I earned about 7% while practically nothing happened. See what I mean ?
It does take some nerve though but it gets easier with time... and you can always take a break, stay in fiat with half or all your money...
Have to warn you though, you will lose a bit at the start, from jumping in the wrong direction - but with caution...
When you do that kind of short trading...do you set for yourself a profit & stop loss limit before you even click the button? If so ..how low do you set your stop loss limit on these kind of trades? Wether it being actually setting an order , or just having a limit in your mind.
So far, I only trade in day time, and I hardly do any limit trades. You see, the difference that makes a trade worthwhile is about $300 up or down, no need to try below that - that is what algos/bots do all the time. Setting stop limits is of course basically the better method but in practice it's also so clumsy and time consuming. I like to immediately see what happens... I do act a lot like the bots do, it basically doesn't matter if the general tendency is up or down, you win two thirds of the trades and lose one thirds, in essence you always win but the gains are little. If stop limits work smoothly at the place you trade, then go for it - test it out a few times where there's no risk and find out, and then tell me ;)
Oh, I keep watching two charts all the time, I'm a visual person... I mark my limits on the charts, with yellow markers. Very intuitive.
Thanks for taking the time to answer.
To sum my question: At what -% do you accept a loss?
If for example in a 5 min candle you think you bought the dip...but it turns out it goes lower.
The overall tendency is very important, it's not that II entirely disregard the allover scenario, expecting to either rise or fall - this is the context I'm operating in and that enables me to relativize.

This is what bots DON'T do...
As an example, I made some profits yesterday entirely on BTC (no need to jump from coin to coin, that only makes it confusing and I do have a life and can only concentrate on one thing at a time) and I sold my btc at 15300, having bought at 14762 (I bought the other half at 12500 a few days ago, hodling that) - however I bought again at 14500, expecting another rise towards 15000 which never happened, so got out again at just above 14100 realizing this would go down way more... and this morning it had fallen to 13300. Now I'm a bit undecided if I should buy at the current 13+-, expecting a fall down to 9.5 k or so...
but also expecting a rise to 17 k hopefully this coming week - why bother, it's Christmas after all and this sort of thing can be a bit ennervating in the long run ;)
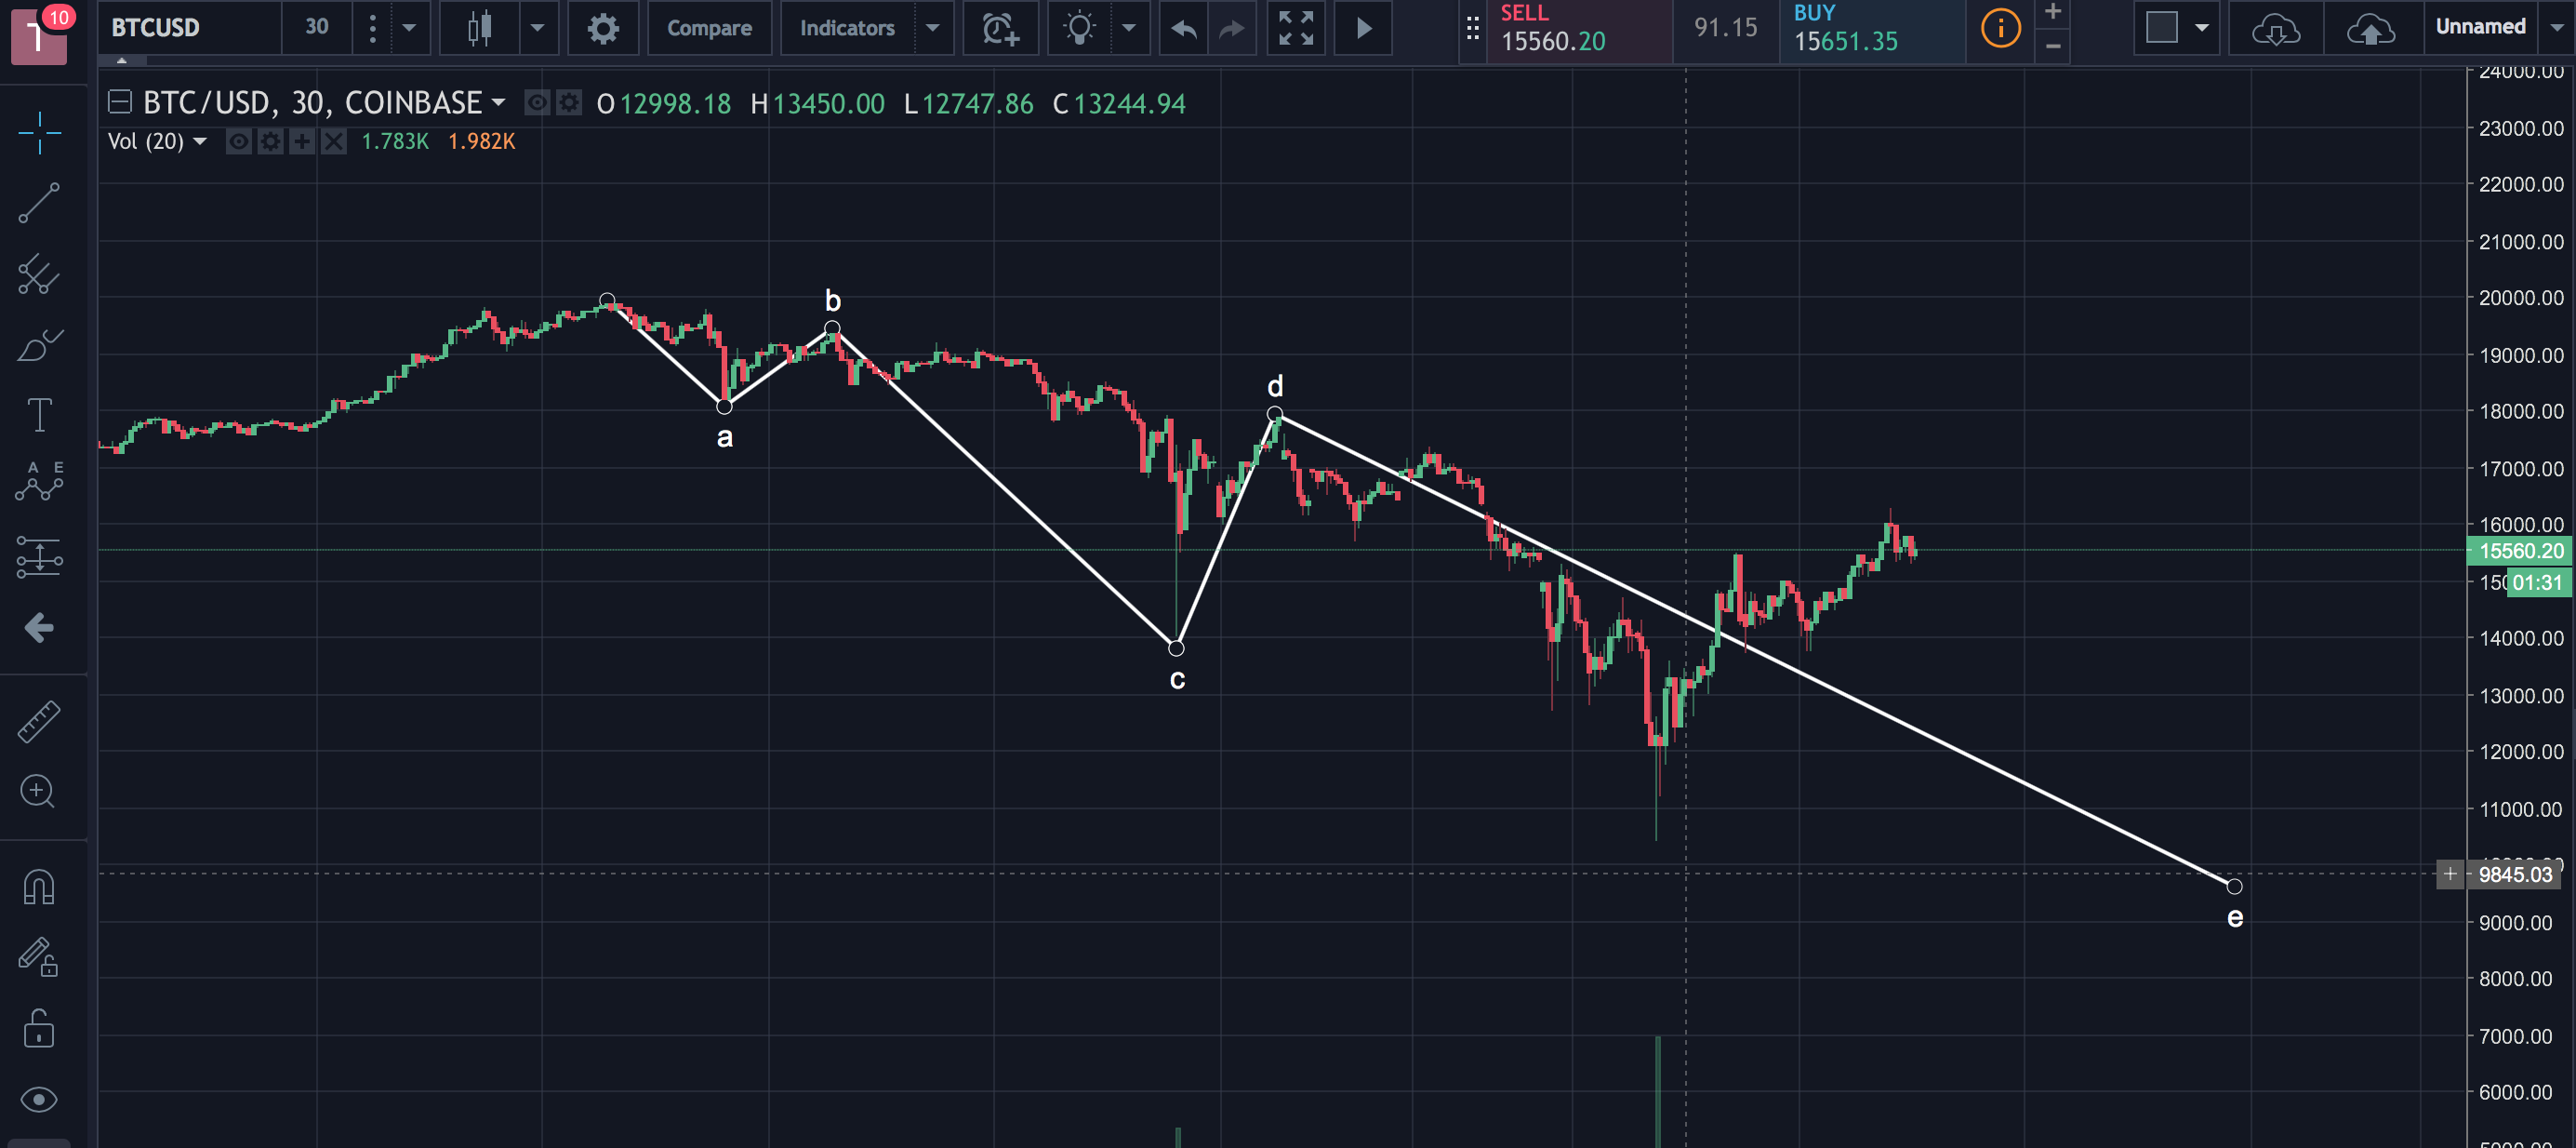
If you look at the one hour chart, you will find we've been forming another little head and shoulders... and if you measure that it leads downwards to about 10500 depending on the exact way you measure the distance, and so i tend to expect what the Fibonnacci retracement says about the entire correction so far, measured from the September low (see attached).
In a word, I'm trying to get intuitive at this, which is what always worked best for me. In that sense, it seems to work best on the graphic level, as in charts rather than numbers, or geometry rather than arithmetics. This is why I cannot give a definitive answer to the percentage question.
In the end, it's your decision where you draw the line between fear and greed ;)
Could just go up or could go down to 8k$ then up. Anyway the probablitiy it won't go back to 20k$ in the next 3 months is really really thin imo
lol
https://steemit.com/bitcoin/@haejin/essay-why-is-time-projection-so-difficult-for-technical-analysts
Agreed, as i said before to my friends that wanted to start investing, this crash was a good opportunity to buy :)
This is what I'm seeing:
I think that yours is exaggerated... just a possibility, not probable. Were having such slow rise because of low volume because the ratio of BCH/BTC is rising again, meaning that many people rather invest in Bitcoin Cash. Humans have no real loyalty, so they ruin the overall success (here of bitcoin and altcoins like Litecoin and ETH) by giving in to short-term gratification. This is what Elliot Waves is all about but you rarely have situations where two stocks are directly opposed and one is actively out to destroy the other. The effect isn't usually overwhelming, but in times of changing tides it can be.
We shall see...i appreciate your feedback @jojof and @johnnystimit. I am here to learn and come up with my own TA. I can't follow along and not try!
What I meant is, I think the last wave is rather LONG, not that it's in the wrong place ;)
I so hate elongated lows...
We're definitely in a typical Christmas Market though, where the bulls are being attacked by Reindeer Of Peace ;)
Thanks for the clarification. I think I drew the last wave as more as a trend movement line :) I hope to see the price fall to around 10k on GDAX...let's see!
I expect about 9.5 to 10... but maybe that'll never come.
As long as it will rise again it really doesn't matter.
Keep dreaming, train is on the way to 20k again
@haejin could you do an update on BTG ? it has been a while and the coin seems to be hibernating.
Nice!