Bitcoin (BTC) Mid-Day Update: The Upper White Trend Line Needs to Hold as Support

SUMMARY
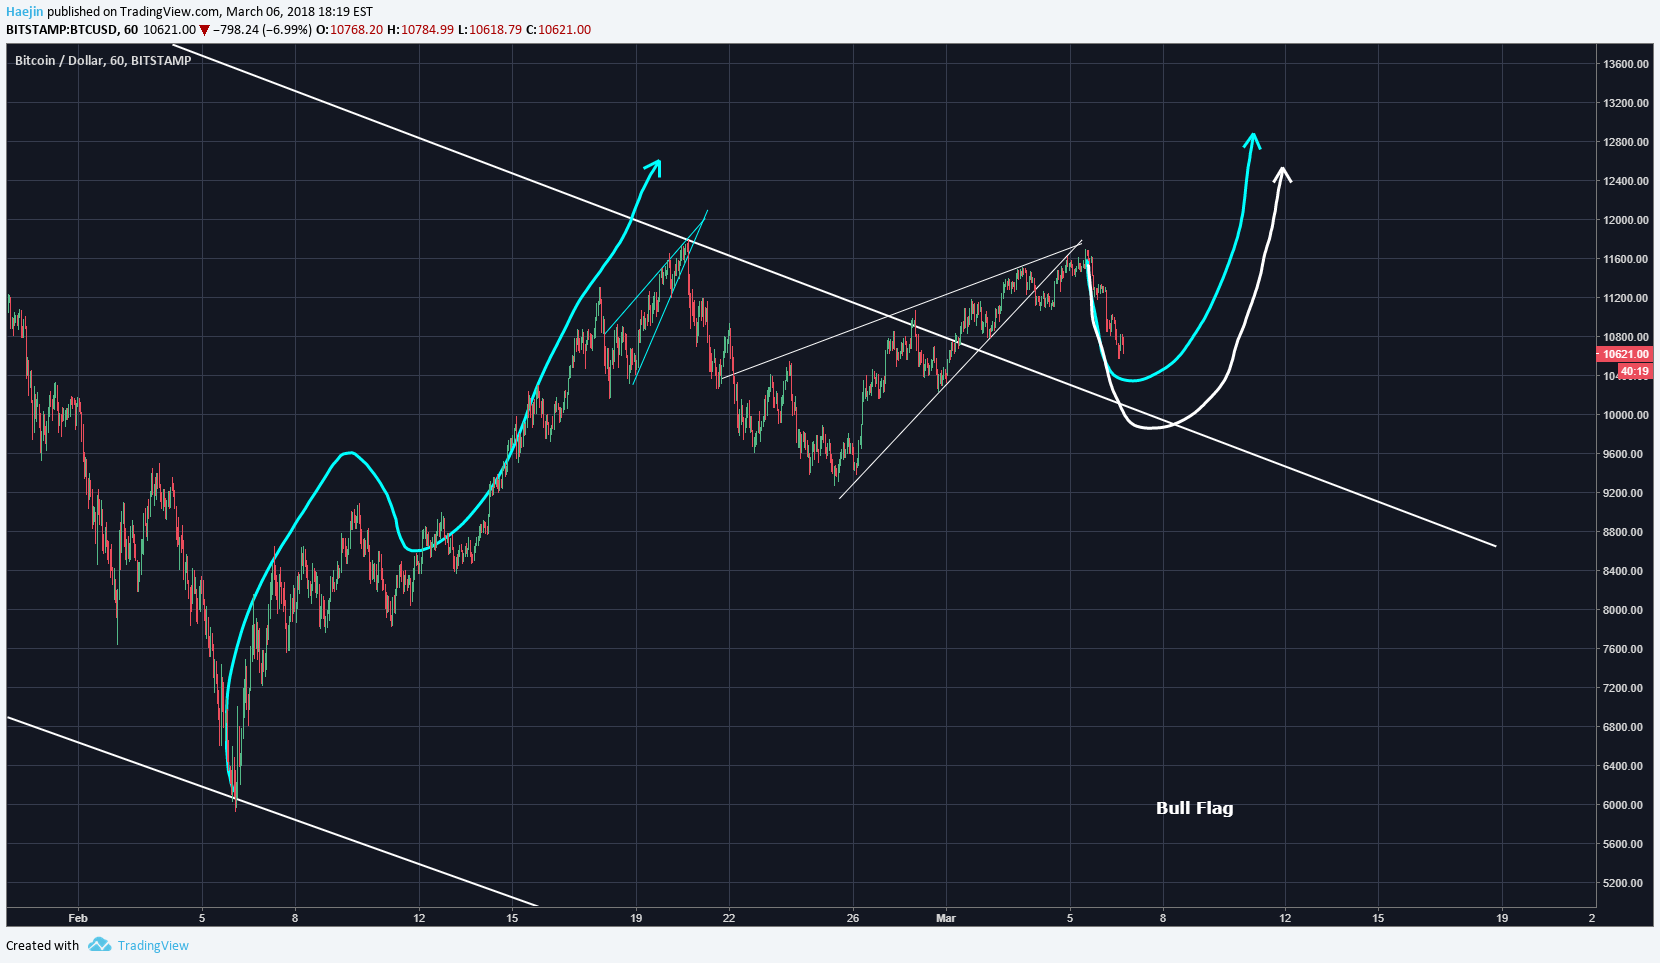
Bitcoin (BTC) price action today has been declining after breaking down from the upward pointing wedge pattern. Thus far, it is and will likely remain a minor correction that coudl follow either the blue or white arrow pathway as shown in below chart:
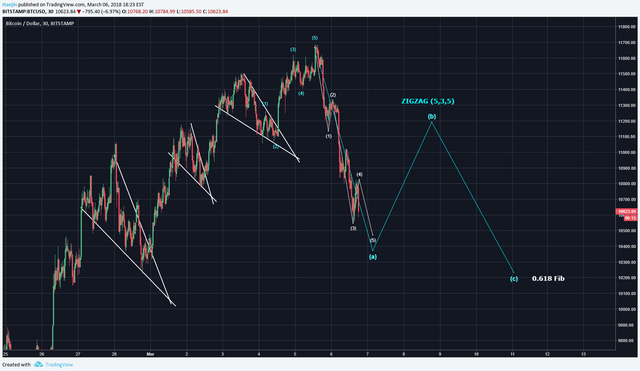
I've updated the Elliott subwaves to count a full impulse with the new price data. I believe blue corrective wave (a) will probably reach the 0.5 Fib zone while and following the (b) wave bounce; the blue (c) could decline towards the 0.618 Fib zone. This correction still has the indicators for a ZigZag (5,3,5) correction. Let's see when the blue (a) completes and the onset of (b) takes place during ovenight price moves.
Legal Disclaimer: I am not a financial advisor nor is any content in this article presented as financial advice. The information provided in this blog post and any other posts that I make and any accompanying material is for informational purposes only. It should not be considered financial or investment advice of any kind. One should consult with a financial or investment professional to determine what may be best for your individual needs. Plain English: This is only my opinion, make of it what you wish. What does this mean? It means it's not advice nor recommendation to either buy or sell anything! It's only meant for use as informative or entertainment purposes.
Please consider reviewing these Tutorials on:
Elliott Wave Counting Tutorial #1
Elliott Wave Counting Tutorial #2
Elliott Wave Counting Tutorial #3
Laddering and Buy/Sell Setups.
Laddering Example with EOS
Tutorial on the use of Fibonacci & Elliott Waves
@haejin's Trading Nuggets
Essay: Is Technical Analysis a Quantum Event?
Follow me on Twitter for Real Time Alerts!!
Follow me on StockTwits for UpDates!!
--
--


We're still stuck in this range. So much for the Network Effect.
Thanks
Thank you ^^ as always
Waiting for it to reach 10.000$ dollar to invest some ;)
I share graph and analysis
Taking the height of the triangle as a wavelength parameter that we already see that it was exactly fulfilled in the first cycle of correction waves
A correction of 5,3,5,3,5 could take us to 9,200 dollars again.
What you think?
Your graph shows a 3 3 5, it's a flat correction in EW theory. It's a really probable option, time will tell.
Great!!
Much appreciated Haejin!
Thanks again for all your posts. I will be watching the 50 DMA closely. Below that and Look Out Below!
Really informative update. Thanks
Coins mentioned in post:
Congratulations, your post received one of the top 10 most powerful upvotes in the last 12 hours. You received an upvote from @ranchorelaxo valued at 228.34 SBD, based on the pending payout at the time the data was extracted.
If you do not wish to receive these messages in future, reply with the word "stop".
Congratulations @haejin, this post is the fifth most rewarded post (based on pending payouts) in the last 12 hours written by a Superhero or Legend account holder (accounts hold greater than 100 Mega Vests). The total number of posts by Superhero and Legend account holders during this period was 39 and the total pending payments to posts in these categories was $4051.77. To see the full list of highest paid posts across all accounts categories, click here.
If you do not wish to receive these messages in future, please reply stop to this comment.
Thank you