Bitcoin (BTC) Morning Update: An Alternate to Consider

SUMMARY
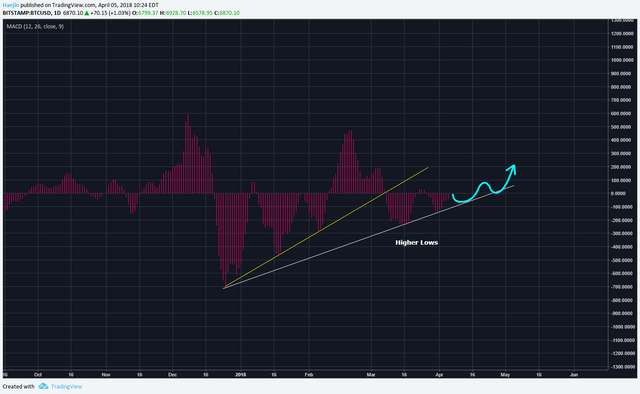
Here is the daily MACD histogram for Bitcoin (BTC). The higher low series in two trend, yellow and white, is quite attractive with bullish connotations. The fact that the histogram is the 9 day moving average compared to the white line indicator which is 12 days and the red line indicator the 26 day; the histogram moves and turns faster and earlier. I use it as an early warning or indication. The higher low series is telling me that a turn is likely and that turn is probably up. Also, it tells me that the lagging indicators (white and red lines) will also follow. It's very encouraging.
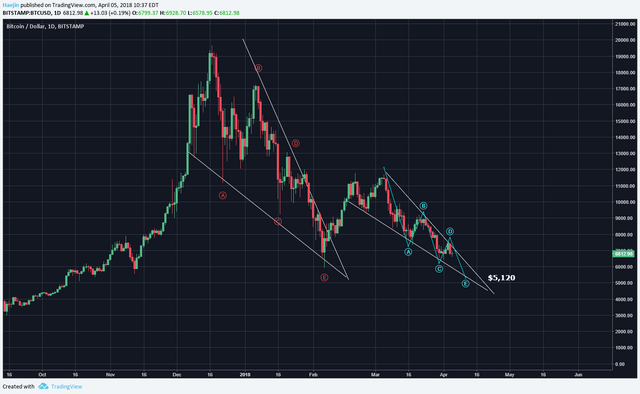
Here is a bit more on the alternate count which jives with the blue W bottom pathway. The chart shows a microwave count of what could be the final ABC (blue). Wave A has five distinct subwaves, B has distinct three abc waves and the final C could be generating its subwaves white 1, 2,3,4,5. Of these 1 is complete and the current bounce could be 2 which will be followed by the 3,4,5.

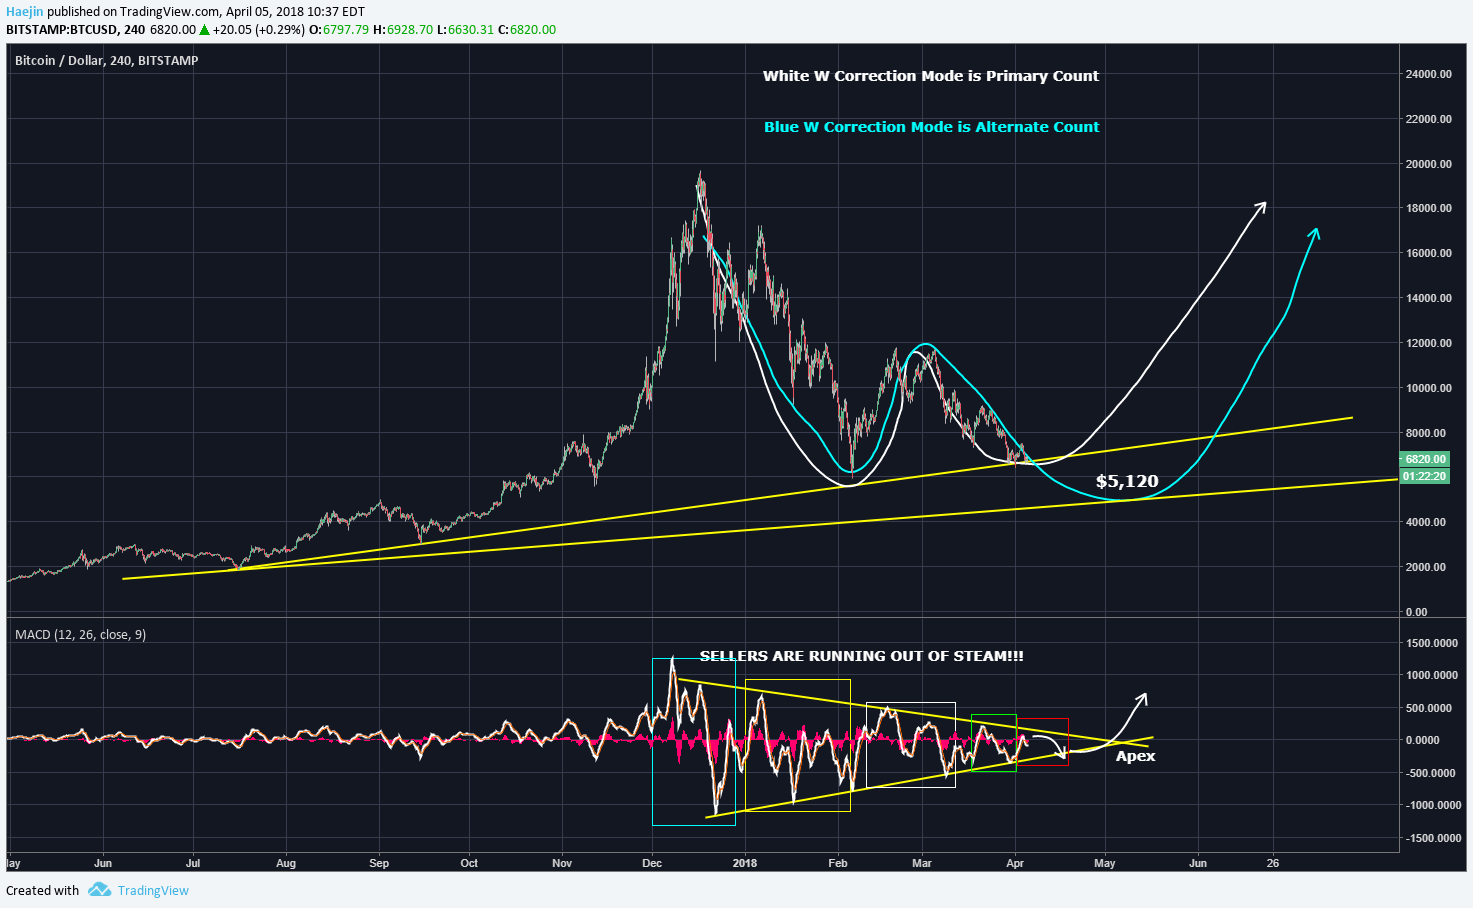
The above would fit into the below chart with the $5,120 bottom target zone.
Regardless of the alternate, price still shows that its in the white W pathway and that still remains the primary.
Legal Disclaimer: I am not a financial advisor nor is any content in this article presented as financial advice. The information provided in this blog post and any other posts that I make and any accompanying material is for informational purposes only. It should not be considered financial or investment advice of any kind. One should consult with a financial or investment professional to determine what may be best for your individual needs. Plain English: This is only my opinion, make of it what you wish. What does this mean? It means it's not advice nor recommendation to either buy or sell anything! It's only meant for use as informative or entertainment purposes.
Please consider reviewing these Tutorials on:
Elliott Wave Counting Tutorial #1
Elliott Wave Counting Tutorial #2
Elliott Wave Counting Tutorial #3
Laddering and Buy/Sell Setups.
Laddering Example with EOS
Tutorial on the use of Fibonacci & Elliott Waves
@haejin's Trading Nuggets
Essay: Is Technical Analysis a Quantum Event?
Follow me on Twitter for Real Time Alerts!!
Follow me on StockTwits for UpDates!!
--
--


Its a scary looking chart man I wish it would just stop going down :((
Agree, momentum appears to be slowing down on the downside, as you point out on the MACD...so we are basing now. The question is will we break to the upside or continue down. We haven't gotten the confirmation that price once to go higher as of yet, we probably need a catalyst or buyers to step in and buy price.
Double bottom. Oh yeah. Everyone jump in. The water is warm lol Seriously at this point there is more potential to buy rather than short.
There were big money sellers so I think the down trend hasn't ended.
Wish I had more cash on hand. Thinking about that alternate makes me want to do a garage sale 😂
Still the best TA atm: http://cryptosrocket.com/btc/2018/03/29/lets-see-the-big-picture-and-whats-next
With all due respect I am not sure what Haejin means by final ABC - the whole correction can be seen as ABC zigzag ( 5-3-5) but final ABC of what ? Final wave can only be a 5 wave impulse or diagonal for ABC correction. So not sure where ABC is coming from ? I think we will dip lower than from Feb 5th $5900. I explained my count here -
https://steemit.com/cryptocurrency/@dkalita123/why-btc-eth-and-other-major-cryptos-are-following-same-pattern
I have been calling same scenario ABC zig ZAG correction from days now - look at my comment yesterday here at Haeijin post. Also i have explained this on my post. ETH following the same pattern as well.
https://steemit.com/cryptocurrency/@dkalita123/why-btc-eth-and-other-major-cryptos-are-following-same-pattern
I hope graph analysis could be much simpler than this. Thanks for keep us updated.
nice info bro ^^
esperare