Bitcoin (BTC) Morning Update: The Seller Population is Depleting FAST!

SUMMARY
The MACD chart below can be seen from the perspective of the Sellers. At the beginning of the correction, they gave all they had to bring Bitcoin (BTC) down! That represents the first blue rectangle. Then, after a brief respite, the Sellers tried again and managed a lower low at 5,900, a near term victory. This is represented by the yellow rectangle. Sellers then regrouped and once again gave all they had and fired their best shots....but, uh oh, only a higher low was achieved in price at $7,200. This failure to achieve another lower low is shown by the white rectangle box. And now, the Seller population is highly depleted and they have only a few shells of ammunition left. They are firing ALL they have to try and break that long term support line and generate that badly needed trophy of a lower low. However, the Seller activity is obeying the confines of the contracting yellow lines of the symmetrical triangle. The Seller population is depleting at an alarming rate and the bears know this as desperation is setting in. The below MACD chart projects a bounce is highly probable towards the upper yellow line; then one more decline towards the lower support before a sizable breakout potential that could be a sight to behold. The timeframe is into mid April or so.
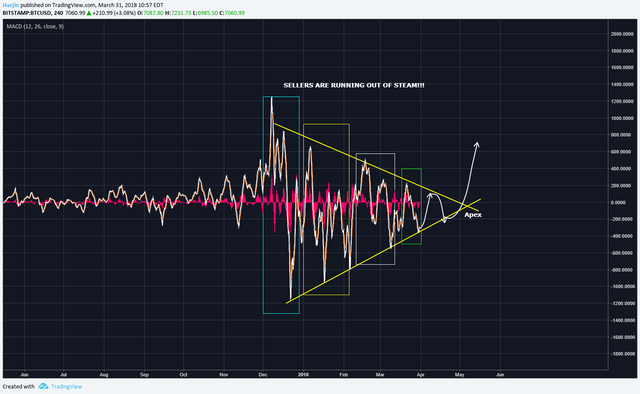
Here is the same MACD with the price activity. The MACD pattern is favoring the white W corrective pathway. The current higher low of price could have very bullish implications; as long as the first long term support holds! Exciting days are ahead of us!

Legal Disclaimer: I am not a financial advisor nor is any content in this article presented as financial advice. The information provided in this blog post and any other posts that I make and any accompanying material is for informational purposes only. It should not be considered financial or investment advice of any kind. One should consult with a financial or investment professional to determine what may be best for your individual needs. Plain English: This is only my opinion, make of it what you wish. What does this mean? It means it's not advice nor recommendation to either buy or sell anything! It's only meant for use as informative or entertainment purposes.
Please consider reviewing these Tutorials on:
Elliott Wave Counting Tutorial #1
Elliott Wave Counting Tutorial #2
Elliott Wave Counting Tutorial #3
Laddering and Buy/Sell Setups.
Laddering Example with EOS
Tutorial on the use of Fibonacci & Elliott Waves
@haejin's Trading Nuggets
Essay: Is Technical Analysis a Quantum Event?
Follow me on Twitter for Real Time Alerts!!
Follow me on StockTwits for UpDates!!
--
--


great update!
I've been spending some time on tradingview lately to catch some alternate ideas and see what the top analysist have to tell. From all I've seen I honestly can tell that your updates are still most valuable to me, wonderful how you brought up the MACD pattern!!
I figured this out early and therefor I don't even bother with Trading View anymore. Haven't checked in a few months.
@haejin is the shitter. You are the toilet. Get it?
By 2019, my hater shades will be on full tint and the MACD will be in record highs...
guessing theres no such thing as freedom of speech in the mind of the first people who viewed your post. haters are quick off the mark today
Haejin has so many troll commenters. Just remember, you get the most flak when you are over the target!
You are awesome Haejin, thank you! I am back on the TA train. I will be contacting you soon, to get together via skype. Keep up the great work!
Thanks for the updates you have been given to us,great work done.Thanks keep on.
The upward momentum is slowing down. Get ready for another dip from the $7000 range to below $6000.
very good BTC analysis: http://cryptosrocket.com/btc/2018/03/29/lets-see-the-big-picture-and-whats-next