Bitcoin (BTC) Morning Update: Trendline Support is Holding Steady

SUMMARY
NOTE: Apologies for the morning update being delayed. Unfortunately, no videos today but will return tomorrow.
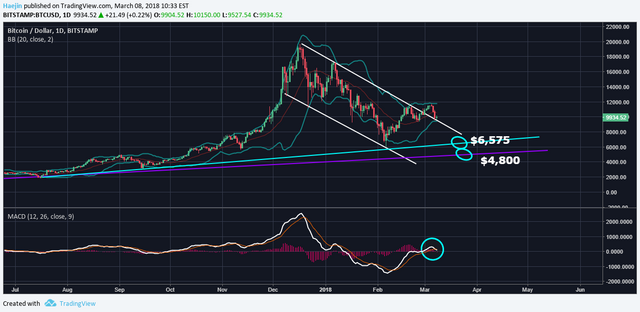
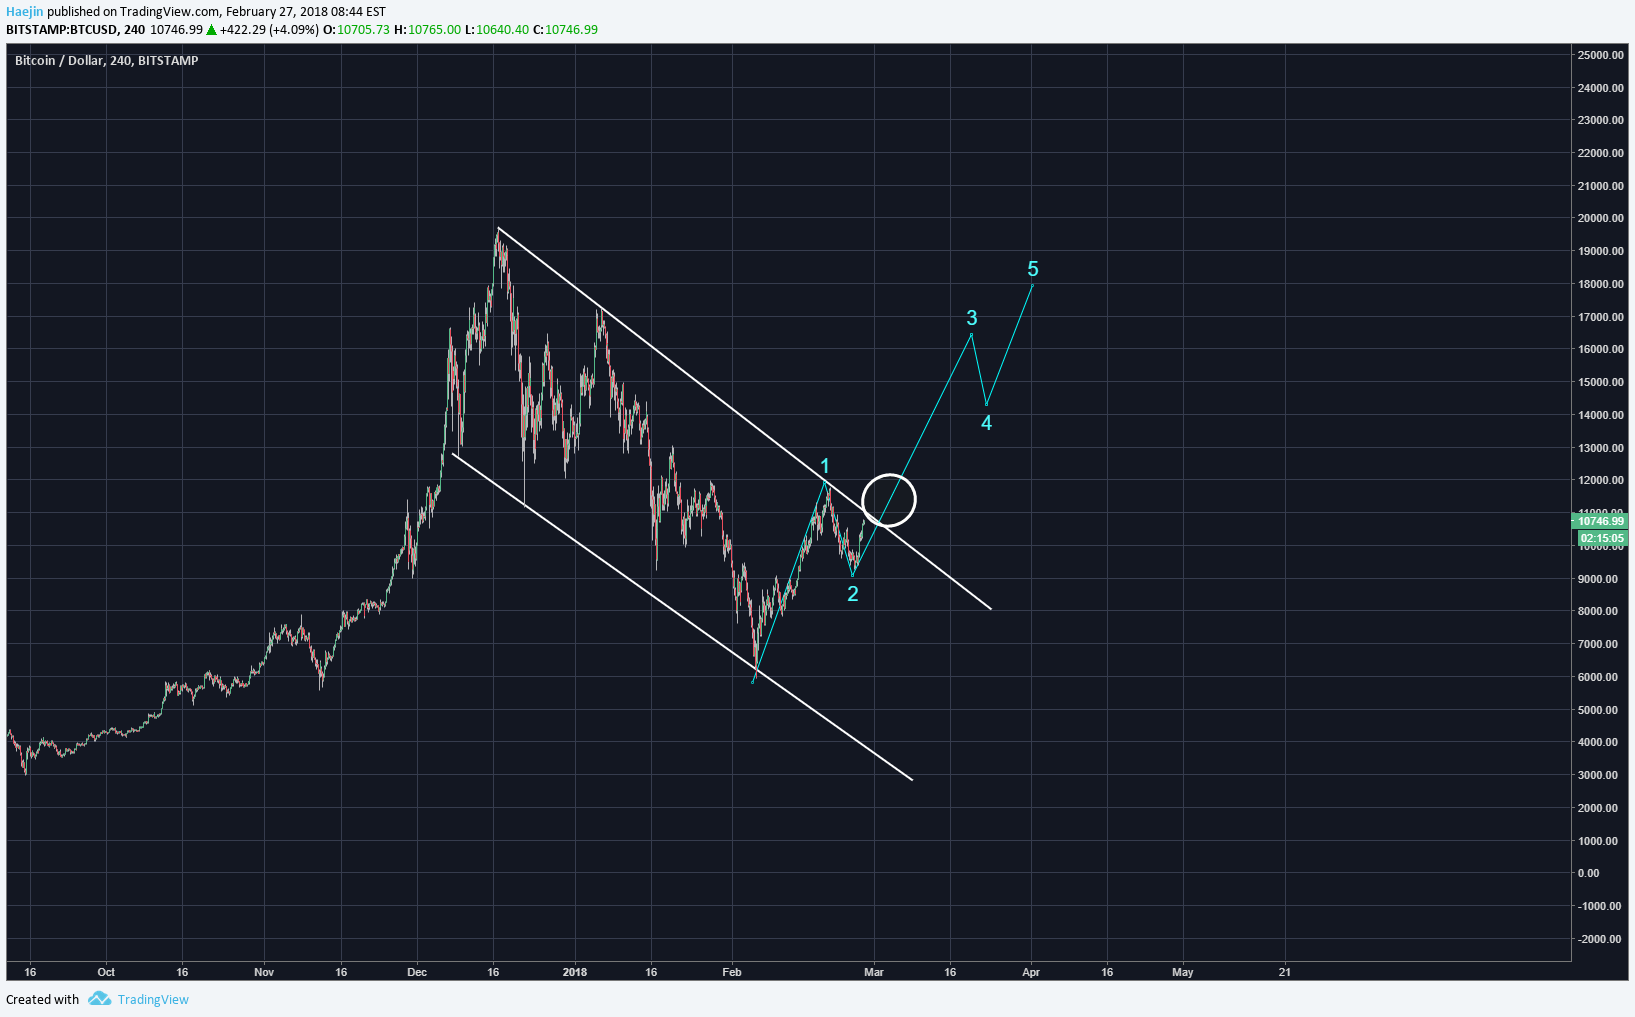
Bitcoin (BTC) overnight price activity has NOT decisively broken through the upper trend line support. So far, this is very good to see. The chart below shows that price is now bouncing off the white trend line support and as long as this support holds against any breach; the bull wave count is still in play. The lower bollinger band represents the -2 Std Dev point and even at this level of stretch, price usually doesn't stay too long and so the bounce is currently occuring. Fib retracement (no shown in chart) is at 0.86 which is the square root of 0.78.
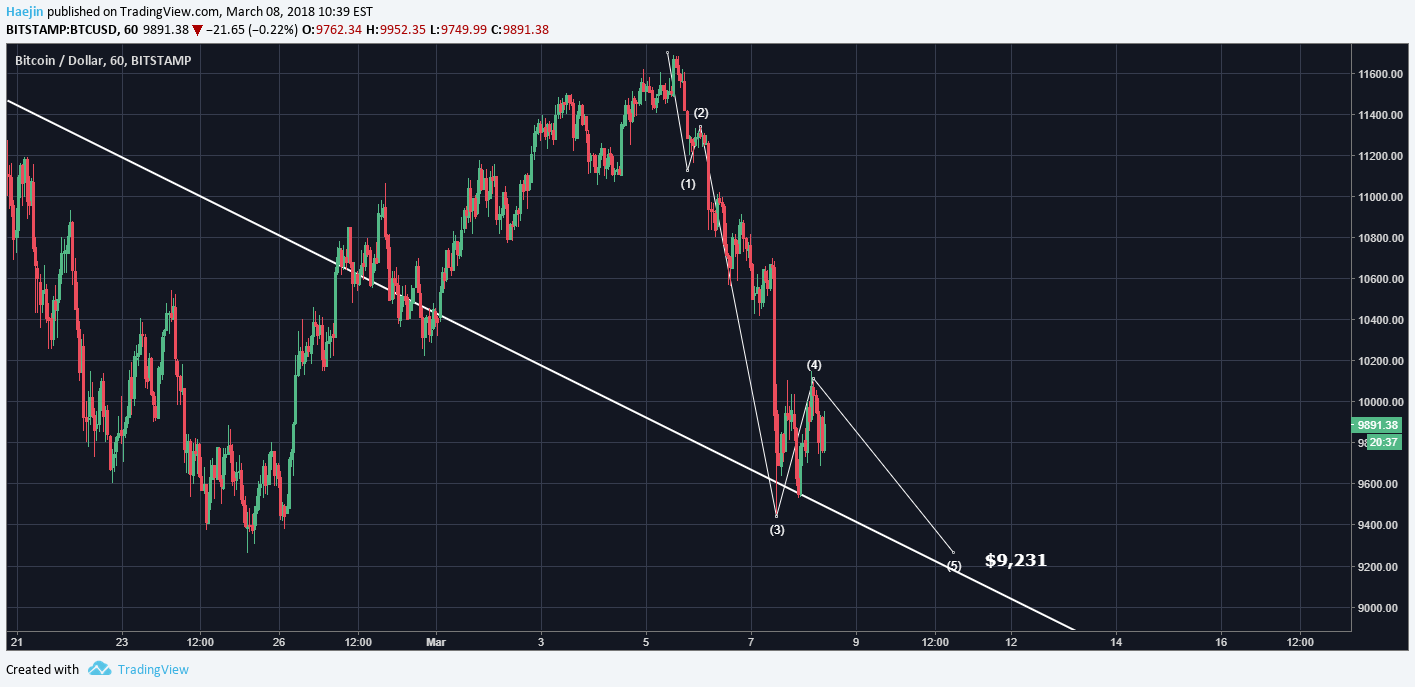
The closeup shows he impulse sub waves. From the looks of it, there is likelihood that wave 5 is complete. The current price moves shown for wave 4 is very overlapping and that's the usual attribute of a wave 4 or 2. This means a lower low is still probable to around $9,231 or so. Unless price starts making higher lows much above current levels; a lower low is projecte.
Legal Disclaimer: I am not a financial advisor nor is any content in this article presented as financial advice. The information provided in this blog post and any other posts that I make and any accompanying material is for informational purposes only. It should not be considered financial or investment advice of any kind. One should consult with a financial or investment professional to determine what may be best for your individual needs. Plain English: This is only my opinion, make of it what you wish. What does this mean? It means it's not advice nor recommendation to either buy or sell anything! It's only meant for use as informative or entertainment purposes.
Please consider reviewing these Tutorials on:
Elliott Wave Counting Tutorial #1
Elliott Wave Counting Tutorial #2
Elliott Wave Counting Tutorial #3
Laddering and Buy/Sell Setups.
Laddering Example with EOS
Tutorial on the use of Fibonacci & Elliott Waves
@haejin's Trading Nuggets
Essay: Is Technical Analysis a Quantum Event?
Follow me on Twitter for Real Time Alerts!!
Follow me on StockTwits for UpDates!!
--
--


There are Multiple Head and-Shoulders Tops and Bottoms, also known as Complex Formations. They may be described quite sufficiently as Head-and-Shoulders Reversals in which either the shoulders or the head, or both, have been doubled or proliferated into several distinct waves.
A common form consists of two left shoulders of approximately equal size, a single head, and then two right shoulders, again of approximately even size and balancing the two on the left
Still another, of which you will usually find several good examples at any Major Market Turn, consists of double shoulders on either side of a head which is itself composed of a small but quite distinguishable Head-and-Shoulders development.
We have mentioned the tendency toward symmetry in the simple Head-and Shoulders Formation. Patterns of the Multiple or Complex type show an even stronger urge toward symmetry — so strong, in fact, that it may be counted on in determining trading policy. If there are two shoulders on the left, there are almost always two on the right of nearly the same size and duration. (Of course, one does not know that a Multiple is in process of formation until its right shoulder becomes evident.) Except in volume, the right-hand half of the pattern is, in the great majority of cases, an approximate mirror image of the left.
There is something about Multiple Head-and-Shoulders patterns especially pleasing to technical chart followers. Because of their symmetrical tendencies, it is fascinating to watch them evolve to completion. Once completed, however, they may try your patience by their seeming reluctance to “get going” with a new trend. On that account, it becomes easy at times to jump to the conclusion that they have “blown out,” i.e., produced a false signal. Actually, except in the matter of extent of move which we have already discussed, they are fully as reliable as the plain Head-and-Shoulders. False moves are relatively rare with both. And in those extraordinary cases when a Complex Formation does go wrong, it still stands, like the plain Head-and-Shoulders, as a warning that the final Reversal is near.
We can lay down specifications for it in much the same words as we used for the Head-and-Shoulders Top. Here they are, with the portions that differ in principle from the Top printed in italics.
A. A decline, climaxing a more or less extensive downtrend, on which trading volume increases notably, followed by a Minor Recovery on which volume runs less than it did during the days of final decline and at the Bottom. This is the “left shoulder.”
B. Another decline that carries prices below the Bottom of the left shoulder, on which activity shows some increase (as compared with the preceding recovery)
but usually does not equal the rate attained on the left shoulder decline, followed by another recovery which carries above the Bottom level of the left shoulder and on which activity may pick up, at any rate exceed that on the recovery from the left shoulder.
C. A third decline on decidedly less volume than accompanied the making of either the left shoulder or head, which fails to reach the low level of the head before another rally starts. This is the “right shoulder.”
D. Finally, an advance on which activity increases notably, which pushes up through the neckline and closes above by an amount approximately equivalent to 3% of the stock’s market price, with a conspicuous burst of activity attending this penetration. This is the “confirmation” or “breakout.”
re: Technical Analysis of Stock Trends, 9th edition
This is one of the greatest comments I've ever read. Thanks for all the info.
You are welcome, I am glad you enjoyed it.
sweet baby jesus, what a comment 👌👍
Thank you very much!
interesting, has there ever been a Multiple Head-and-Shoulders patterns in btc or other cryptos before?
I looked around several times and couldn't find anything this spectacular.
We hit $9,050. Now what? Is the bounce looking good or more lower lows?
As long as no more Japanese Whales decide to cash out, we may see a bit of an upswing.
fucking hell mate, ya can get more sense rubbing a lamp. The old way was to go out into the garden and dig up some earth and put it in your masters cup when he wasn't around, then rinse it off with some off his swines urine and drink concoction. You will have prophetic powers for the next cycle of the sun. Unless it is in the sign of Aquarius then you need to use his masters horse muck instead of the swines urine.
That's almost exactly what I was thinking! Except, it also had something to do with tea-leaves and bone dice...
Update: Bitcoin drop going as forecast. Second medium normal retrace target is the scope at 8,758. It could rise after. But the February low didn't hit its normal retrace. I am not so certain this drop wont go below February's low.
You mean - we could get another and this is going to even a lower low?
I'm mostly out. I'm hanging onto a small amount of BTC and a few popular alts, that's about it.
Yeah, it takes nerve to HODL. 😀
Possible, but I was wrong on the first drop (I thought it would go lower). I thought it would go to 5600/5300 and Ripple .047. The targets are still valid. But this is out my pay-scale range. I have never witnessed such large moves in such condensed time frames. I play comparative moves. This thing has no blueprint to compare too. I want to say yes about reaching those targets. I just cant.
I will say nothing is spectacular about 8658. Its just a normal retrace. The numbers don't provide an opinion. What happened in the past is not a certainty of what will happen in the future. I figured 11,670. resistance. Had a better than 3 to 1 chance to force 8,658.. It still hasn't happened. I want to take baby steps in the forecast. At some point some chartist may target 6,800. Like I said, I want to target lower. Pattern wise I do target lower. But man the % of the moves are astronomical in the time frames.
Oh and thanks for the vote. I sent you one and a follow.
https://smartsteem.com?r=steem3
I realise this was probably written quickly but you might want to consider re-reading and correcting some of the typos to be sure you are communicating clearly at a time when some people might be rattled after yesterday.
I assume you mean the 5 sub-waves wave 3 are complete. Likewise, leading the article with a snapshot of the bigger picture bear scenario might cause more fear when it seems you are actually saying that at this point things are in limbo. Thanks as always for the article.
Haejin, I think you made a typo saying wave 5 is complete ;) Please edit for others.
Unless you mean subwave 5 of wave 4?...
Wave 4 will not have 5 sub waves. Only 3.
You were wrong. What trend line were you looking at?
Now that we know the market is heavily manipulated by the Mt Gox fiasco, can't we say that TA is not as effective? TA relies on sentiment and fibbonaci, whereas now, there is one party that has significantly more power in this market?
upvoted, I wonder whats haejin's take on this. Upvote for visability please
He is correct, already dip $9200
The technician claims, with complete justification, that the bulk of the statistics which the fundamentalists study are past history, already out of date and sterile, because the market is not interested in the past or even in the present! It is constantly looking ahead, attempting to discount future developments, weighing and balancing all the estimates and guesses of hundreds of investors who look into the future from different points of view and through glasses of many different hues. In brief, the going price, as established by the market itself, comprehends all the fundamental information which the statistical analyst can hope to learn (plus some that is perhaps secret from him, known only to a few insiders) and much else besides of equal or even greater importance. - Magee
Haejin uses Elliott Waves which accounts for news or events. Just hodl guys, even if it goes down to $6k, is it worth the risk of having it jump up to over $12k again and missing out? BUY THE DIP SON!
that doesnt apply to this situation, the EW principle refelcts sentiment, this market manipulations are stronger then sentiments. I have his record and haejins calls havent been incorrect since end of december due to this kind of manipulation.
No, as haejin kept repeating last year (haven't been listening much recently), Elliott Waves always predict the future and whatever happens, only happens to prove the prediction. This eternal wisdom is immediately, intuitively accepted by followers of the great God Allah and many, many others.
We have a prime example of this truth in what happened from Christmas to now, and hasn't haejin since then started to intensely use Fibonacci and resistance lines ?
this is entire bullshit (specially what you tell about Allah). I follow haejin since september and I can tell you his btc calls have been incorrect since the end of december. And the reason for that is that the market manipulation is to strong in this case, the EW principle applies to a normal market where sentiment is in control. Each of the huge BTC dumps by this wale caused a crash and messed up each of haejins predictions. Sorry to tell you but you should keep your mind straight.
So sorry to tell you that you might be better off with a radio shack sarcasm detector - available at the low price of $19,49 (batteries not included).
You can download it directly after payment.
haha good one 😁 I have seen a lot on this site already so honestly your comment didnt even surprise me that much (except the religious part which has been a bit exceptional 😅)
Did you notice that he clashed with cryptopassion because he started copying the triangle method from that guy, and that he only started to use fibs this year ? He recently discovered Bollinger bands, so he may be using the Gann fan and Vegas Wave soonishly. This will make his predictions even more precise, especially since he has also discovered the Cassandra Effect (making negative predictions in a downtrend). So even if this may mean the end for bitcoin, it won't for haejin, as little as the death of Arab culture stopped the rise of Islam...
@barsic,
I love jojof for her elegant and incisive savagery.
IMHO, you can save your money on the radio shack toy. I, too, can be slow on the uptake but you recovered nicely.
Much respect for your avatar image!
Regards,
Rick
PS, Sadly, and with strong hopes that I'm wrong, we may have lost jojof. I'm desolated.
@haejin how come that you have changed your forecast for Bitcoin upwards to such a big plunge?
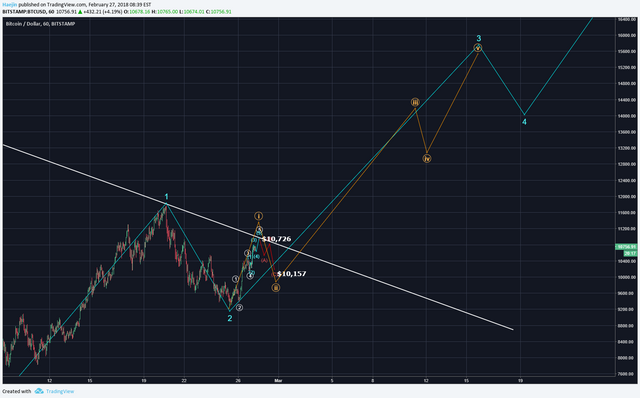
Here's your post made on 2018.02.28:
Here's my post on the same date (2018.02.28) and I missed only 1.000$
TODAYS VIEW:
Careful. You may get flagged by the great man hmself if you get too close
This is much Better Than Your Vidoes. They ALL Look The EXACT Same. BORINGGGGG. Even the weather channel looks different everyday. How about adding some FLARE to your blog. Not the SAME COPY PASTE Bullshit over & over. I thought @Steemcleaners took action on that kind of bullshit. You have COPY & PASTED the SAME BULLSHIT EVERYDAY for MONTHS!!!