Bitcoin (BTC) Morning Update: Two Paths but Same Destination

SUMMARY
Bitcoin's (BTC) overnight price action has not yet resolved whether the smaller blue wedge pattern is complete and confirmed yet. The blue chart shows the blue bull wick as did the larger fractal to the left. The v-neck type of reversal from the bull wick is also seen in the blue fractal as well as the steep decline towards the bottom. The blue abcde also place well and the sam with the subwaves. So, the pattern is complete and the confirmation in the form of a breakout is needed. Let's see how the daytime price action plays out.

The alternate count calls for that lower low which might also have a bull wick and a v-neck turn. IF this pathway becomes actualized, then it would certainly bring the price closer to the Apex. A breakout while price is closest to the Apex often provides better sustainability in the reversal.
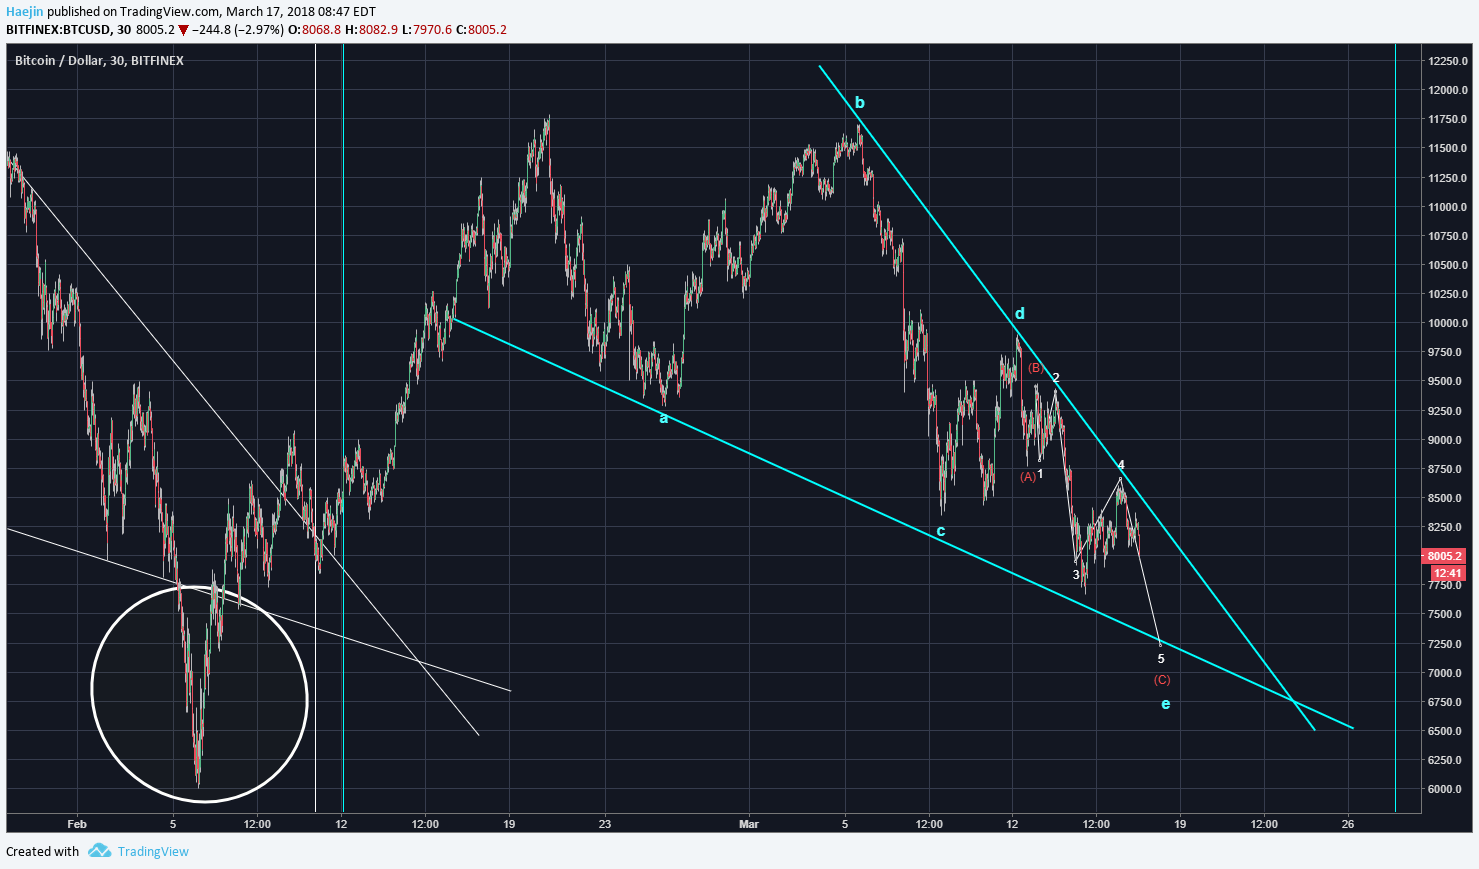
Regardless of which pathway is taken, both will like confirm the completion of the blue wave c in the below chart and start towards completing blue wave d and then e. It is very important that the lower white triangle line hold against any decisive breaching.

Legal Disclaimer: I am not a financial advisor nor is any content in this article presented as financial advice. The information provided in this blog post and any other posts that I make and any accompanying material is for informational purposes only. It should not be considered financial or investment advice of any kind. One should consult with a financial or investment professional to determine what may be best for your individual needs. Plain English: This is only my opinion, make of it what you wish. What does this mean? It means it's not advice nor recommendation to either buy or sell anything! It's only meant for use as informative or entertainment purposes.
Please consider reviewing these Tutorials on:
Elliott Wave Counting Tutorial #1
Elliott Wave Counting Tutorial #2
Elliott Wave Counting Tutorial #3
Laddering and Buy/Sell Setups.
Laddering Example with EOS
Tutorial on the use of Fibonacci & Elliott Waves
@haejin's Trading Nuggets
Essay: Is Technical Analysis a Quantum Event?
Follow me on Twitter for Real Time Alerts!!
Follow me on StockTwits for UpDates!!
--
--


Price found buyers at $7600 and has been basing the last couple of days. In order for price to move up, we need to see a candle close above $8600 on the daily chart. If price is able to achieve this feat, the buyers must then take out the sellers at $9000.
If the sellers remain in control, we could see price test the $6000 level again, which would be a buying Bitcoin at an extreme discount which was the origin of the huge move that took price to $20000 and where price bounced back to $12000. Thus, this level would be the best level to buy Bitcoin for the long term.
There we go. Double bottom. People don't want to believe it. People should look at the alt coins for better % gains. Once the correction is over and you spent a couple grand on those coins you'll make great money. Could even pierce 6k good but the discounts will be great.
Yes, I do not want to believe that we are going to hit the $6k level again. 😉
Same here. Ripple under .5 too. The week and days are still closing lower. Nothing bullish about that atm. A Bitcoin day close below 6812 isn't good for Bitcoin bulls. The week close is a lower week close of the year. Not a bullish signal.
I think it depends on what alt coins you're talking about. I'm seeing ICOs and new alts coming out all the time. People are still trying to get into the space even after the recent bubble. I think once these alts that are coming in kind of fizzle away and the remaining legit coins are still around, then the market can shift back up, and those good alts to bitcoin will rise. I'm looking at Ethereum and Litecoin to get a boost as things settle, but also EOS and NEO.
The bubble is not over yet.
Unless a coin is a scam you can bet they'll reach the old highs at least. So it's simple math. Lots to pick from. But this time instead of wave 5's being hit on the old highs and falling it will be a lower wave number. I'm looking for continuation after the old highs. Not double tops. Could it be a wave 1 taking us to the old highs? Don't be shocked. I'd love that. Everyone would.
The day ranchorelaxo starjuno or yourself does not vote one of this post: your followers, steemit and the world will see what is your
Upvotes from this Post
How difficultl it was to see this comming in January. Though you did tell us all to cast buy ladders around the support zones. I had set my buy ladders, at 10000, 9000 8000 7000 and 5000. The 5000 and even the 7000 never filled up. That is good, because now I still have some cash in hand, but it has burned in my pocket all these time. Now we might see this lower low, and I should use the cash that wasn’t used in this ladder, but I do find that hard. Afraid of falling even deeper. In any case thank you for all the wise recommendations and the physiological support in these rough times.
I agree with the big picture and nice chart work. I would also take into condsideration "whales" in the market with big buy ins and sell offs which are not as likley to be predicted.
Just like this one too :)
If all would be a "panic" sale and not this slow, slow forming bearish market I would defenitely see Bitcoin getting up.
But BTC is following the top trend-line for a long time. Problem is that this trend line is lowering at around $ 140,-- a day.
Bitcoin is being squeezed out so "nice and softly" it's getting harder for me to see it ever get back into the $ 10.000,-- zone very soon.
It's gonna hit 7600 very smooth. It's gonna hit 6000 very smooth. Its gonna hit 5000 very smooth. Its gonna hit 4000 very smooth.
Then we can even get into the 3200 to 2500 zone as a panic sale.
After that Bitcoin will show buy and sell orders between 3000 and 4000 for a longer period. In that period we all have to decide if Bitcoin is gonna make it for the long term or if it will just be blown out like a night-candle!
BTC is getting squeezed out softly to these much lower levels.
Mark my words on this one!
Sincerely , technically, no one knows where the price is heading now. I think we need more weeks ahead to get real signals.
I expect to see a test of 6905 on Monday. We exceeded 62% of the decline after a move from 6905 to 11469. We passed weak support at 8072.
For future viewers: price of bitcoin at the moment of posting is 8045.50USD
162 votes makes 1.43$ funny ..i am always follow you and your post makes huge every time ..it's a curse that you never give me any votes ...hahhahah
I've had upvotes from @haejin, maybe because i don't point out 162 votes as being a negative thing?
i have also been upvoted by @haejin
yes, the bitcoin is will up again soon
Very nice post I like it