LINK/BTC Shows a Pattern Setup for a Potential Trend Reversal

SUMMARY
In the scheme of larger degree of trends, these temporary price corrections are meaningless! Why? Because the old equities based paradigm of valuation needs to go out the window when it comes to Cryptocurrencies. Unlike an inflationary based FIAT, Cryptos are deflationary pegged; and so more likely to induce a liquidity shortage event. What does this mean? Let's say one wants to purchase 500k of a very thinly traded coin. It would be nearly impossible to amass such numbers without bidding up. The thinly traded coin simply does not have the liquidity to enable a 500k coin purchase at static price. As coins like Bitcoin is finite supply based, greater participation, especially by Wall Street Hedge Funds, will lead to MASSIVE liquidity shortage driven orgasmic lunges upwards of price. Cryptocurrencies is still thinly participated and that means these price dips are nothing more than very healthy consolidations and the bottoms should be aggressively bought!
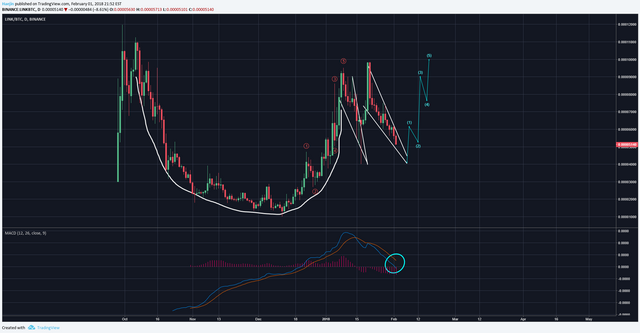
The below chart of LINK/BTC is showing a Cup & Handle that fits well into a nearly complete consolidation phase. The handle pattern is taking the form of a consecutive downward wedge. Prices have a propensity to break out of these wedge patterns. In addition, a successful Cup & Handle also provides sustainable price run ups. The blue Elliott Waves provide a smaller degree of trend should price breach the upper line of the second wedge pattern. The lower support line needs to hold. As the MACD is still declining, it hasn't started to turn upwards yet and a breakout would initiate the curl up of the 12 day blue line (blue circle).
Legal Disclaimer: This is only my opinion, make of it what you wish. What does this mean? It means it's not advice nor recommendation to either buy or sell anything! It's only meant for use as informative or entertainment purposes.
Please consider reviewing these Tutorials on:
Elliott Wave Counting Tutorial #1
Elliott Wave Counting Tutorial #2
Elliott Wave Counting Tutorial #3
Laddering and Buy/Sell Setups.
Laddering Example with EOS
Tutorial on the use of Fibonacci & Elliott Waves
@haejin's Trading Nuggets
Essay: Is Technical Analysis a Quantum Event?
Follow me on Twitter for Real Time Alerts!!
Follow me on StockTwits for UpDates!!
--
--

If this blog post has entertained or helped you to profit, please follow, upvote, resteem and/or consider buying me a beer:
BTC Wallet - 1HMFpq4tC7a2acpjD45hCT4WqPNHXcqpof
ETH Wallet - 0x1Ab87962dD59BBfFe33819772C950F0B38554030
LTC Wallet - LecCNCzkt4vjVq2i3bgYiebmr9GbYo6FQf

Profit Signal - LINK/BTC: Currently it is 20.74% lower than its 24 hours high. Current price: 0.00005130 sats. 24 hours high: 0.00006194 sats
Cup and handle doesn’t get invalidated unless price goes below the cup.
This is good information
Can you analyze WTC?
Hey @haejin. Nice analysis on LINK. Also your point on 'bidding up' makes a lot of sense to me and I think this aspect of investing is often overlooked. btw, I am going to go ahead and drop a coin request for CND?? This coin shot out of nowhere and has remained strong throughout the correction. I would love to hear your opinions on it.
...dear @heajin your good post....i love blockchain.....thank for sharing...
The Real Link UP!!!
Thank you Haejin
I am grateful to you because I always get a lot of information through you.
Yup. Triple bottom and looks like a bull flag to me.