Bottom Confirmed? Bitcoin at 20-day High Near $11K

Bitcoin price has rallied 84 percent from recent lows, suggesting a bottom is in place, although a long-term bull revival is still not certain, according to the price charts
Over the weekend, CoinDesk's Bitcoin Price Index (BPI) rose to $11,279.18, its highest level since Jan. 29. As of writing, the BPI is seen at $10,800 - up 1.59 percent in the last 24 hours. However, a bout of profit taking seems to have pushed the cryptocurrency back below $11,000 today.
While the "V"-shaped rally from the Feb. 6 low of $5,947.40 certainly paints a bullish picture, investors are still divided on whether BTC has found a long-term bottom below $6,000.
Bitcoin seems to have bottomed out below $6,000 as indicated by bullish doji reversal, but the weekly indicators are still less clear about the long-term prospects for the bulls, as discussed below.
Weekly chart
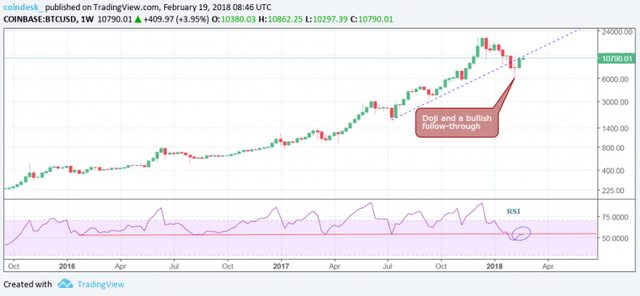
Last week's green candle marked a positive follow-through to previous week's long-tailed doji candle and confirmed a bullish doji reversal. So, it appears a bottom has been made at $5,873.
That said, the position of the relative strength index (RSI) indicates the job is still half done. As discussed last week, during the bull run (2015-2017), at no point were the bears strong enough to push the RSI below the support zone of 55.00-53.00. However, the RSI did drop below the support zone during the recent sell-off, signaling a bear market.
Further, it still remains below resistance zone of 53.00-55.00 (former support). Hence, a long-term bullish reversal is still not confirmed.
Also, a look at the short-duration chart indicates a key Fibonacci level has come into play. Bitcoin prices on Coinbase's GDAX exchange created a red candle (down day) yesterday at $11,228.25, which is the 38.2 percent Fibonacci retracement of the sell-off from $19,891.99 to $5,873.
Daily chart
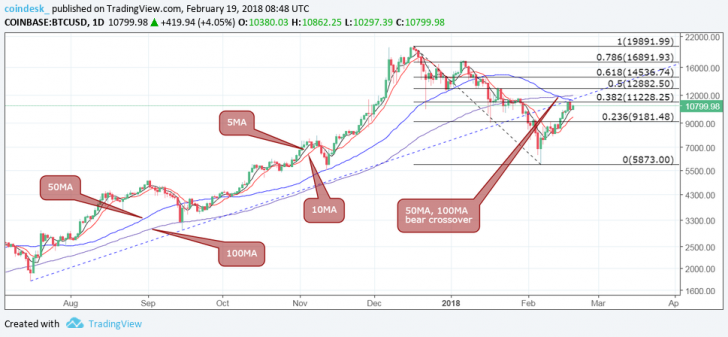
- The ascending trendline (drawn from the Jul. 17 low and Sep. 15 low) is still intact.
- The chart also shows a 50-day moving average (MA) and 100-day MA bearish crossover (short-term average cuts long-term average from above).
- The 5-day MA and 10-day MA are curled up in favor of the bulls.
View
- A move of the weekly RSI above 53.00 would confirm the long-term bull reversal and open the doors for a re-test of record highs. However, on the way higher, bitcoin prices could face resistance at $17,174 (Jan. 6 high).
- Meanwhile, a drop below $9,017.41 (Jan. 17 low) would add credence to the bearish weekly RSI, and the bearish 50-day MA and 100-day MA crossover, and could yield a deeper sell-off towards.
Source: https://finance.yahoo.com/news/bottom-confirmed-bitcoin-20-day-101510413.html
Follow @hidayat4u
If U like Then 

I do not think , Crypto is not similar to stock market.
Congratulations @hidayat4u! You have completed some achievement on Steemit and have been rewarded with new badge(s) :
Click on any badge to view your own Board of Honor on SteemitBoard.
For more information about SteemitBoard, click here
If you no longer want to receive notifications, reply to this comment with the word
STOPCongratulations @hidayat4u! You received a personal award!
Click here to view your Board of Honor
Congratulations @hidayat4u! You received a personal award!
You can view your badges on your Steem Board and compare to others on the Steem Ranking
Vote for @Steemitboard as a witness to get one more award and increased upvotes!