Bitcoin and STEEM chart updates
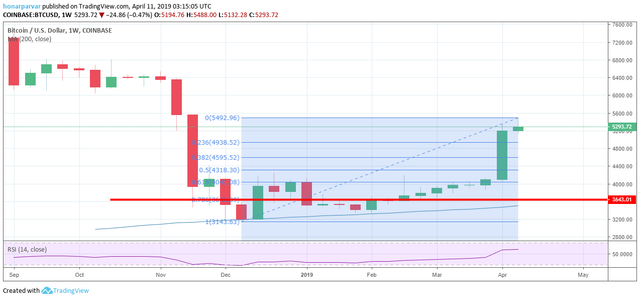
BTC has proven the new major resistance level has slided up from $3143 to $3646

what are these numbers?
if you wonder how I got these numbers, my simple recipe is combining Fibonacci retracement in weekly chart with 200 weekly moving average.
How I combine them?
as long as the chart is moving above 200 weekly moving average, I remain bullish on the longterm picture. the first retracement level above the 200wma would be 0.786 which is $3646
if BTC break below this level, it will test the previous low, $3143 which I believe will be a very risky test and the probability for more liquidation will be high in that case.
STEEM/ETH
steem is testing the 0.00255 level against Ethereum, on the daily chart. if the support breaks, 0.00224 and then 0.0018 will be new support levels. but if it closes above the 0.00255 there will be a high probability of continuing the uptrend we have witnessed since Jan 2019.
To listen to the audio version of this article click on the play image.

Brought to you by @tts. If you find it useful please consider upvoting this reply.