BTCUSD analysis: Old Chap is on the Swing
![]()
Analysis of Bitcoin trend and the most likely scenario for the Bitcoin price movements in the near future.
In this post I applied the following tools: fundamental analysis, all-round market view, market balance level, volume profile, graphic analysis, trendline analysis.
Dear friends,
Another week is over, and so it is time to update trading scenario for the most popular cryptocurrency, Bitcoin. So, let’s start the usual BTCUSD analysis.
But first, I’d like to sum up the results of the previous Bitcoin price prediction.
Last Monday, I suggested that the market was tending towards the bitcoin price correction and that BTCUSD price was likely to go down towards the last local lows.
However, just one day later, there was a very strong of the Bitcoin price up to 6850 USD. The situation was worsened by BitMEX deactivation just ahead the price surge, which resulted in stop jumping and total loss of the deposit for many traders.
To be fair, I must say they had announced the upcoming maintenance work in advance and recommended everybody to exit all trades for the time of switch off.
Nevertheless, according to BitMEX users, BTCUSD strong volatility often coincides with maintenance work on BitMEX.
It is easy to check. I compared the messages on the BitMEX official twitter account and Bitcoin price moves.
I didn’t go far into the history and started analysis since summer.
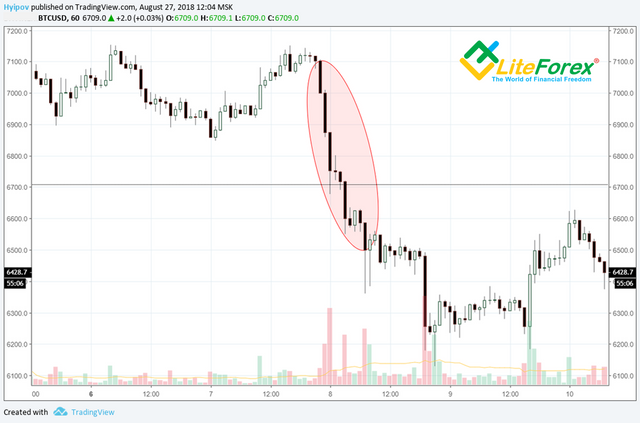
The first maintenance work, mentioned during the summer period, started on August 4.
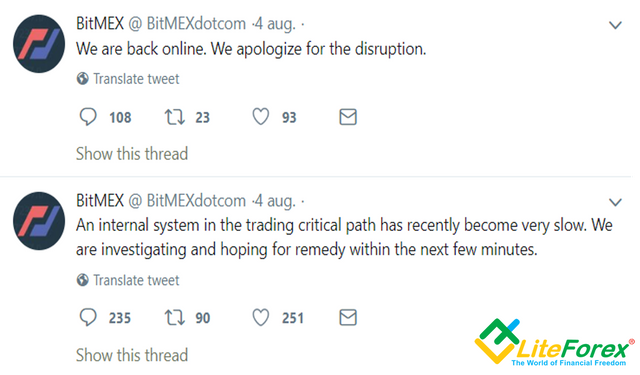
As you see in the Bitcoin price chart below, strong Bitcoin dump occurred at the same time.
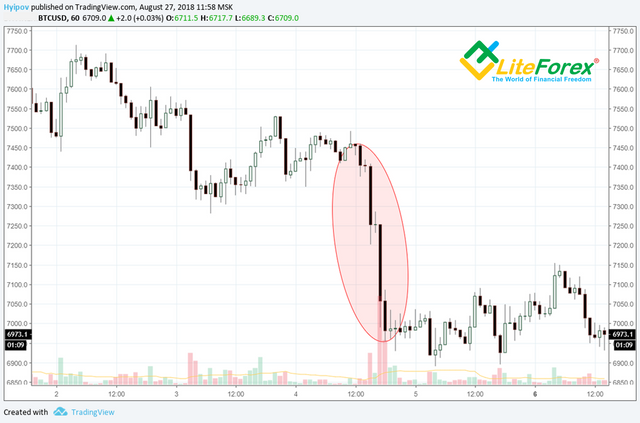
The second problem occurred soon after. The new maintenance started on the platform on August 7.
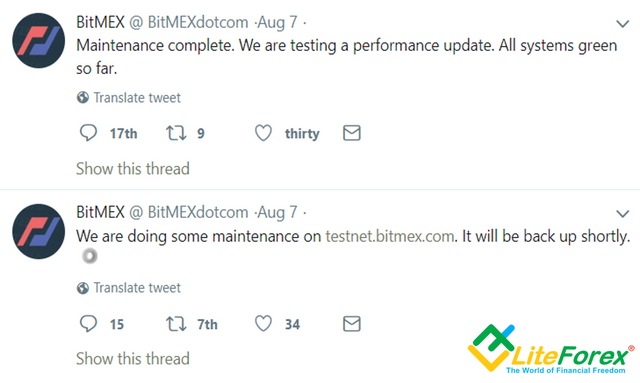
And again, there is a massive BTCUSD sale.
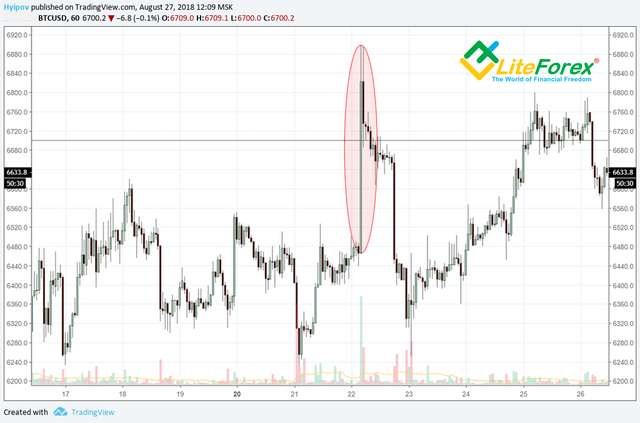
The next maintenance work was widely published.
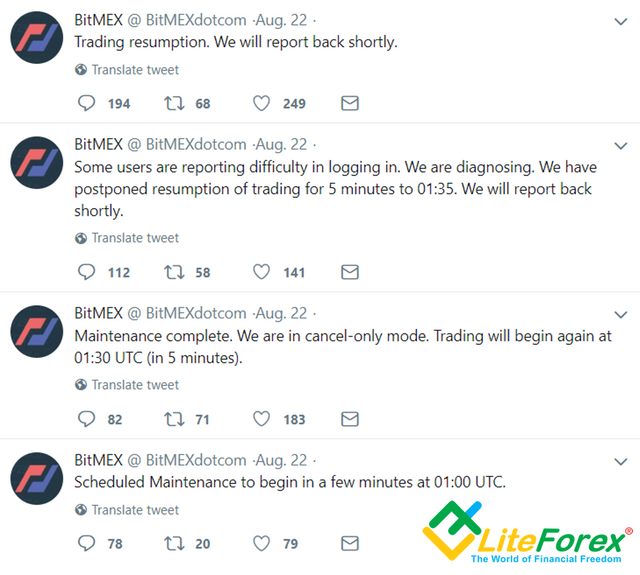
On August 22, we all witnessed a sharp Bitcoin surge by 400 USD just in a few minutes.
It is up to you to decide whether these events were related or happened by chance; but one thing is clear, such manipulations scare off common traders, who feel really vulnerable to manipulators’ illegal activities. The cryptocurrency market is really unpredictable.
As a result of the recent Bitcoin pump, the market sentiment has radically changed, which, in fact, prevented the Bitcoin price from falling down even after the news that ETF application had been rejected.
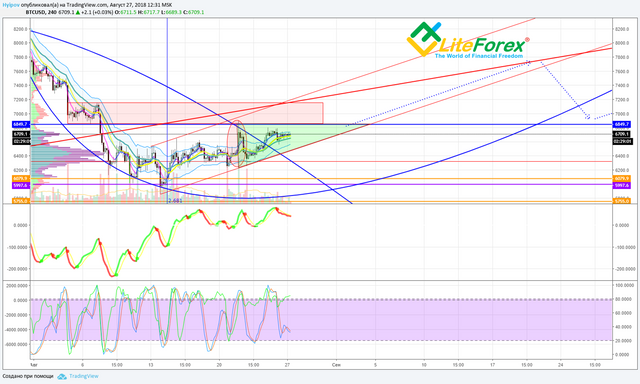
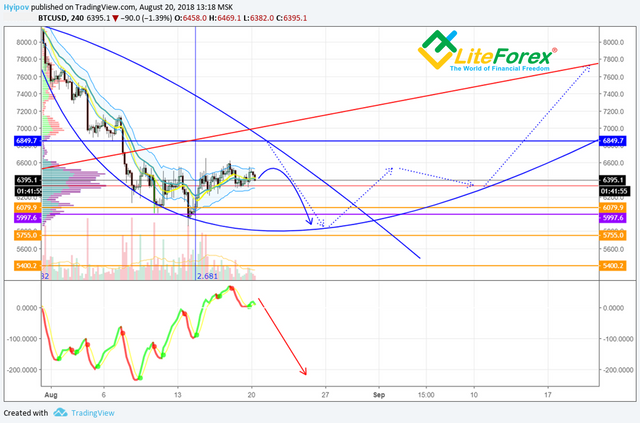
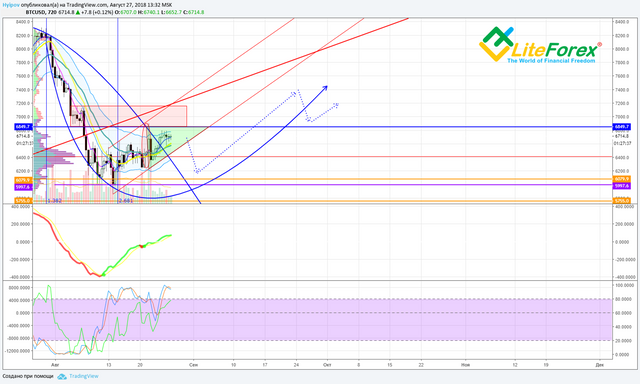
Finally, in the BTCUSD hourly charts, there emerged an upward channel with the key level at 6850 USD.
Now, let’s move on and get to Bitcoin technical analysis. As you see from the chart above, there is a trading channel, being a whole resistance zone above this level. So, the trendline and the resistance levels are making up an ascending triangle, inside which BTCUSD price is now moving.
To figure out, in which direction the price is going to break through the triangle, let’s look at longer timeframes.
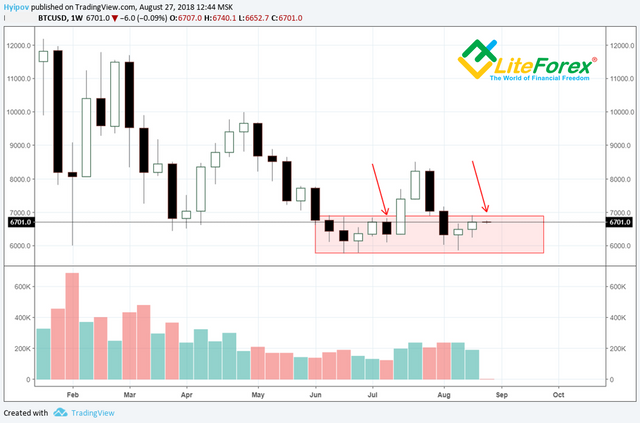
In the BTCUSD weekly chart, the ticker is moving inside the trading channel. The Bitcoin price volatility is obviously getting weaker, and the price swings are getting narrower.
Taking into account these features and the accumulation process within the previous cycle, we can expect that, in a week, there will be a black candlestick inside the trading zone, marked with the red box.
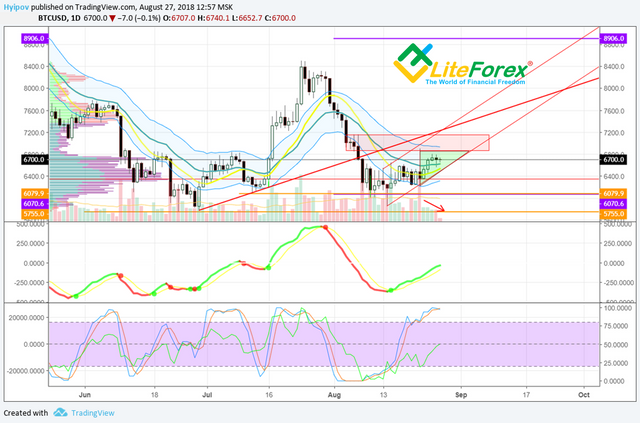
In the BTCUSD daily chart above, you see that the trading volume is declining inside the uptrend, and RSI stochastic is in the strong overbought zone. Although MACD is in the bullish state, we mustn’t forget that its signal are often late and may not indicate the very start of changing market sentiment.
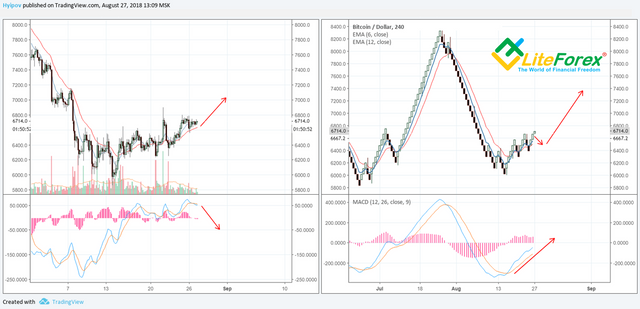
According to my experimental strategy , there are positive signals in the Renko chart in the four-hour timeframe, which suggests the general uptrend right now.
However, within the trend, MACD is sending a bearish signal in the Japanese candlestick chart (on the right). It suggests a possible bearish correction in the near future.
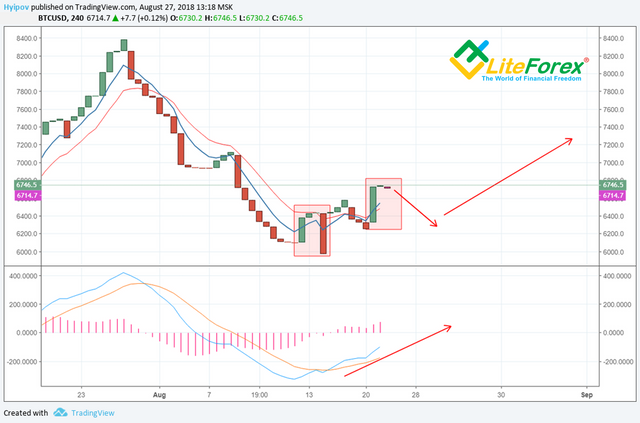
In my recent training post, I described the Line Break Chart . I noted there that the indicator is not efficient during the sideways trend. However, MACD, like with Renko chart, sends quite accurate signals for Bitcoin, though rather late.
In the BTCUSD price chart above, it is clear that MACD confirms the Bitcoin price increase. However, the alternation of bearish and bullish bars in the chart means that the market participants are not certain. Despite the long green bar, you see a thin Neck that may not resist the bearish attack and break down. Finally, the price is highly likely to repeat the pattern, emerged in the mid-August, when the Bitcoin lows were retested.
Summary:
Many investors can suffer from great financial losses if they start bullish attack too early. I don’t yet see any serious reasons for BTC falling down below the current levels, but the market is not ready for the good natural rise. From the manipulators’ point of view, to take the biggest profit at the current levels, they need to either push Bitcoin up above level 7200, to trigger the stops of shorts, or to press it down below level 6200, to close longs. According to the manipulation cost, it is cheaper to make a little dump in the market that will trigger the panic. Moreover, it will crash all the altcoins that have been a little up during the Bitcoin sideways trend.
So, I expect BTCUSD price to be trading at around 6150 – 6400 during this week. There are no reasons for going deeper. When another low is reached, the price should go up and end the week at about 6700 – 6850, thus drawing a hammer or a pin bar in the BTCUSD weekly timeframe. It will be a good signal that the price is to go on increasing.
That is my BTCUSD trading scenario. Go on following the rate and staying informed. I wish my Bitcoin price predictions are useful for you!
I wish you good luck and good profits!
Regards,
Mikhail @Hyipov