Bitcoin Detailed Analysis-What If The Price Breaks $ 16000 or What If It Does Not?
Bitcoin is running at full speed now. Especially yesterday, in just 24 hours, the world’s largest cryptocurrency rose by nearly $ 1,500. How come things suddenly go so fast? And what is the ceiling of this run?
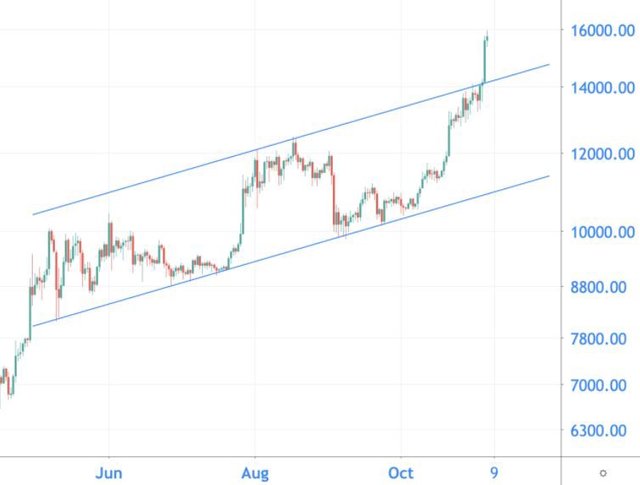
You look at the daily chart below. Since May, bitcoin has been moving in an upward channel, between two upward trend lines. The price has scraped against the top of this channel in recent days, and a correction was therefore expected. It never came, on the contrary. Bitcoin shot through the top trendline with a lot of violence yesterday.

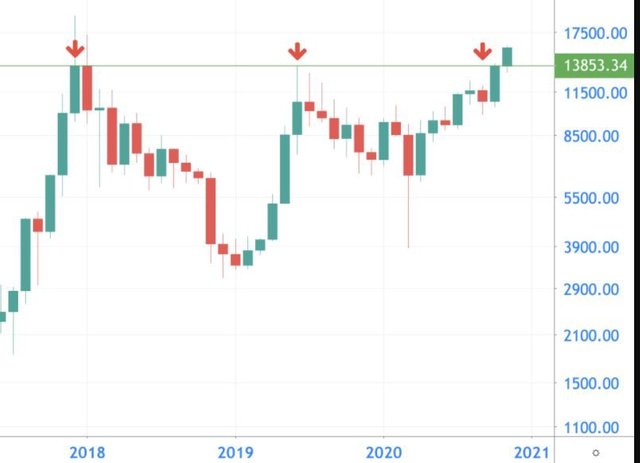
But the daily chart doesn’t give you the full picture. To understand why things are going so fast now, we look at the monthly chart. The last strong resistance was USD 13,853, the green line. This was the highest monthly closing price ever, the first red arrow. In 2019 it was not possible to break this level. You can see that by the second red arrow. And the third arrow indicates that bitcoin just failed to close the month above this resistance.

Final hurdle towards all-time high
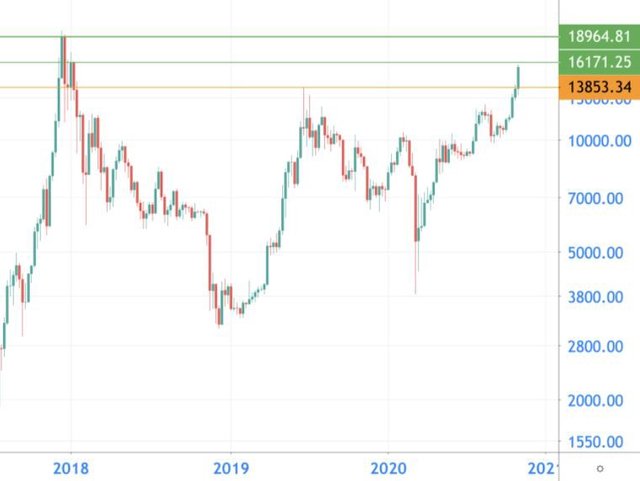
Where is the next resistance for bitcoin? For this, we switch to the weekly chart. The next resistance can be found around 16,170 dollars, the lower green line on the graph. On the chart you can see that this price has been a significant resistance at the beginning of 2018. And above that? There we come very close to the highest value of bitcoin ever. So, around $ 16,000, bitcoin finds the last real resistance towards the top.

The market is overly optimistic.
But before we talk bitcoin towards $ 25,000, it is good to take a step back and look at the market sentiment. According to the Alternative’s Fear & Greed Index, there is extreme greed right now. This figure has not been this high since June 2019.

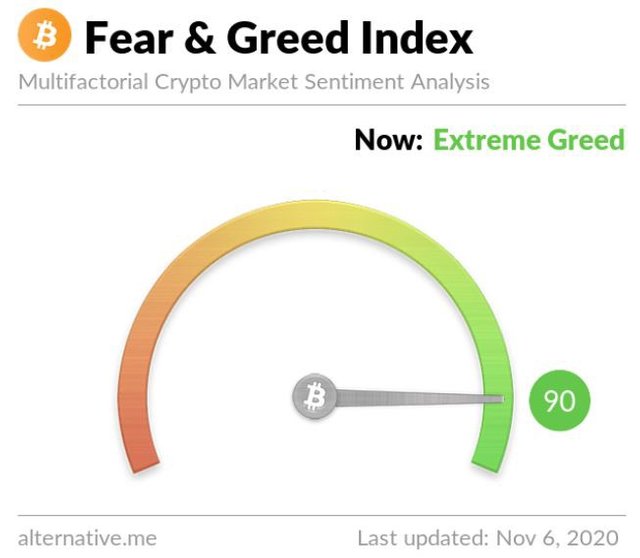
The Fear & Greed Index is an index between 0 and 100 and gives you information about the market sentiment. The figure is a weighted average of all kinds of factors in the market, such as volatility of the price, trading volume, sentiment on social media, and bitcoin’s market dominance.
Currently, the counter is at 90, which means that there is massive greed in the market. This is often a sign that the market needs to cool down a bit. Before we make another move up, the price must correct or move sideways for a while.
What can we expect from bitcoin?
Back to the daily bitcoin chart. The price is gaining momentum. All scenarios are still on the table. To prepare you for everything, we outline two scenarios: bullish (positive) and bearish (negative).
Bullish
Will bitcoin take it one step further in the coming days? We find the first resistance at USD 16,170, which corresponds to the weekly closing price of January 2018. After that, USD 18,964 is in sight, the highest ever weekly closing price of bitcoin.
Bearish
In recent days, bitcoin has risen sharply in value. A correction is, therefore, also a possible scenario. The first support is the top of the channel, around $ 14,600. If there is a massive correction, bitcoin can drop back to 12,000 dollars. As long as the price finds support at the bottom of the rising channel, the upward trend will remain intact.