Bitcoin in Charts | Is This The Bottom?
Bitcoin in Charts | Is this the bottom?
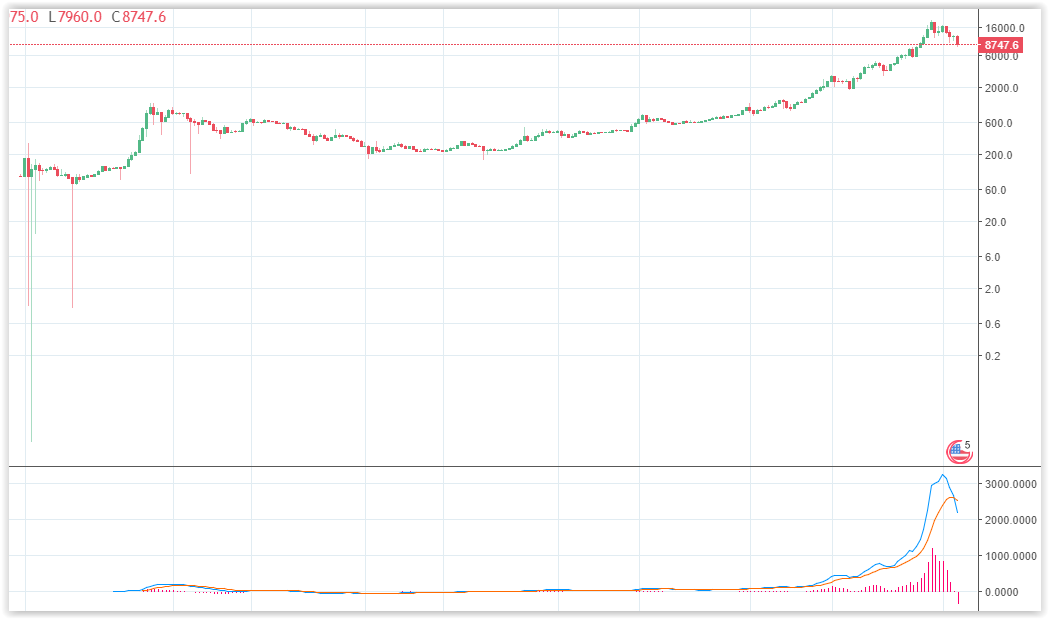
Bitcoin had a bottom today at $7625 on Bitstamp.
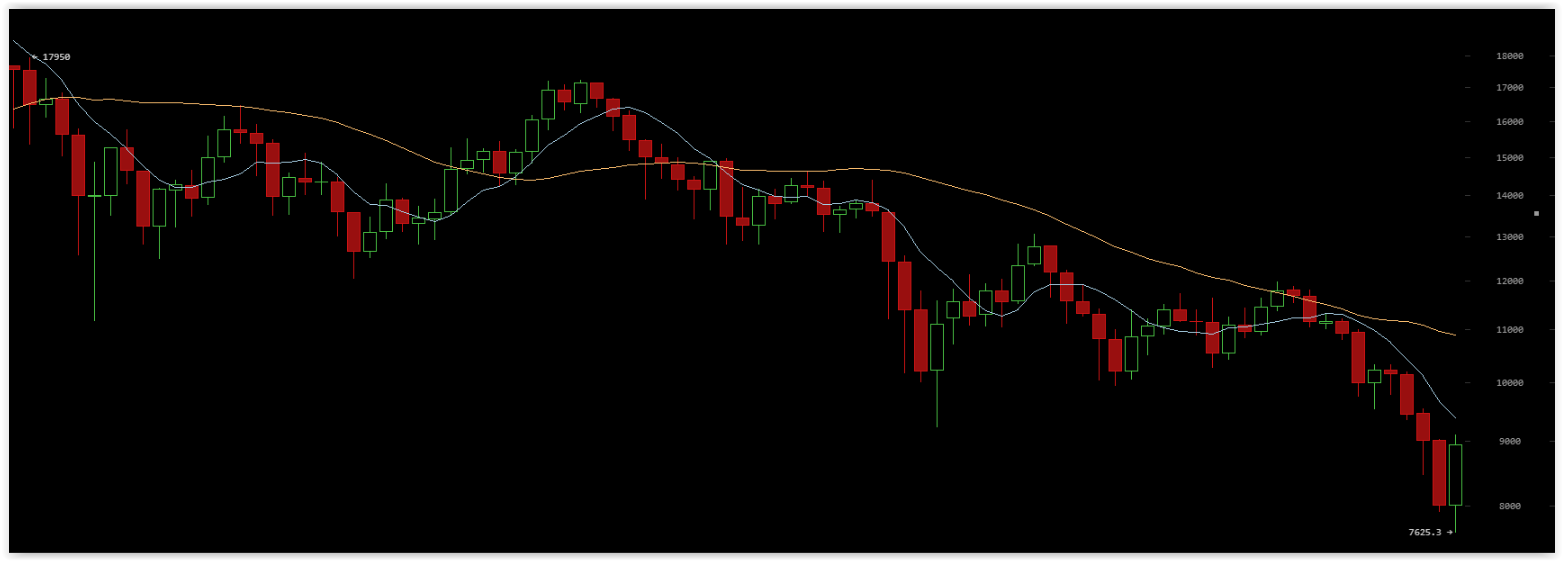
Is this the real bottom and are we still in the bull trend?
Lets find out!
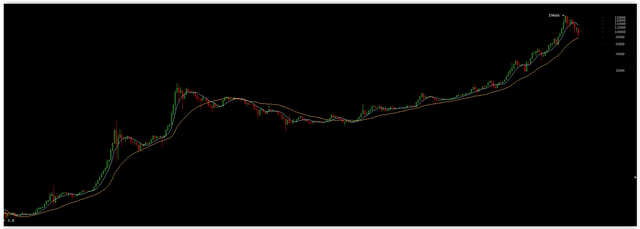
That yellow trend line is the weekly moving average. On the grand scheme of things we seem still on track.
Remember how Bitcoin went up almost than 10.000% in 2017. We're down only 60% from all time heights.
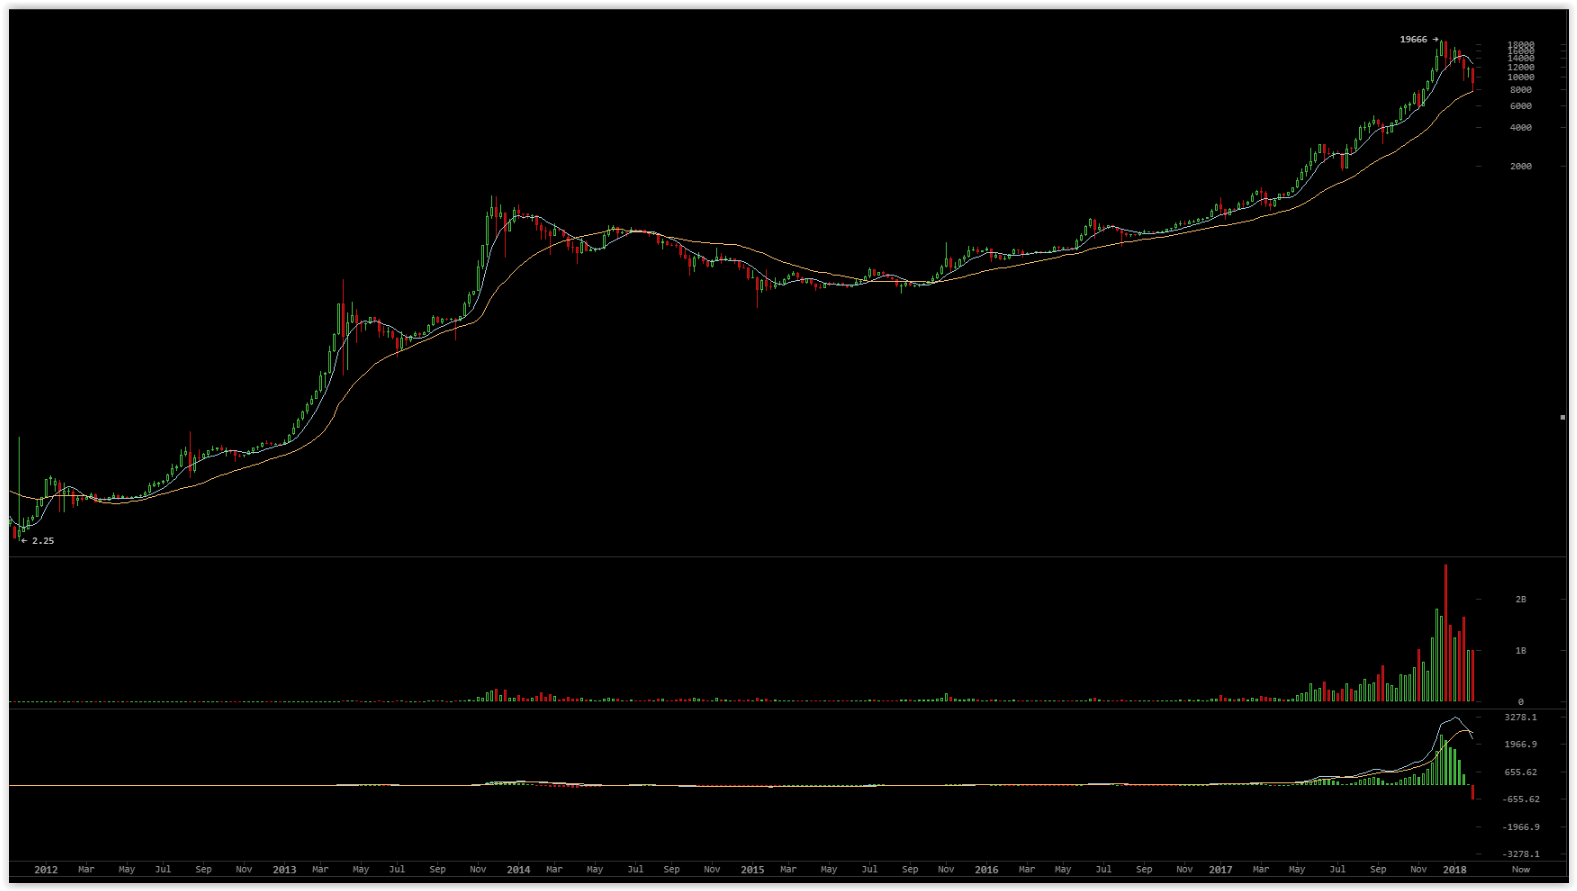
The bottom 2 charts - volume and macd - don't look that good.
When volume was high, it was to the downside (red).
This means people were more interested in selling than in buying.
Only today we see the first big green candle.
The MACD (bottom) indicator looks bearish. We have the first weekly red candle in Bitcoin, and they hardly ever come in single candles.
The reason? Volume is down.
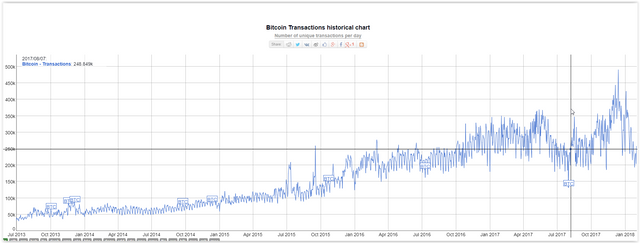
The global bitoin transactions are down the last weeks:
Google also shows lower global search interest:
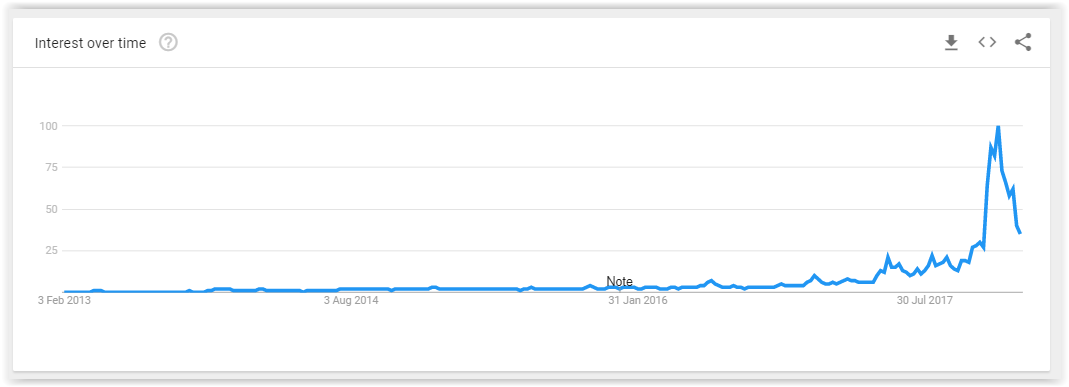
- Google search interest on term 'Buy bitcoin'*
Search interest in terms btc usd, btc krw, btc eur' are also down. Conclusion: the user hype has slowed considerably.
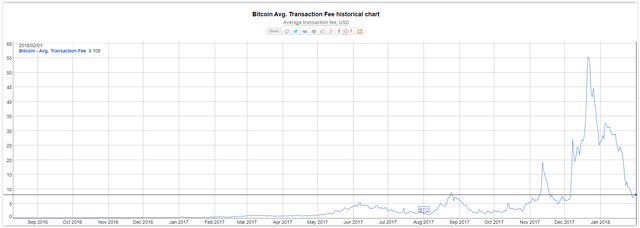
A nice side effect is that Bitcoin transactions are now cheap at around $6 per transaction:
Conclusion 1)
We've seen a januari dip in user interest and consequently in price.
News
There are good reasons for bitcoin to go up from here.
The Lightning network is finally here, allowing bitcoin to scale. With global adoption Bitcoin could become a currency network as much as a store of value network.
The Robinhood trading app is beginning to add crypto trading. This allows a common public to easily buy bitcoin from dollars using a phone app.
And when volume is picking up, the price could surge again.
Tether
The Tether debacle has been on crypto minds for months.
Tether company which issues the popular USDT token, claims they hold 1 dollar for every tether they print. The global worry is they might not have the dollar reserves they claim. They have recently been subpoenad by the US (december 2017) to show evidence of their reserves.
If they don't have the reserves, USDT, Tether and Bitfinex will be in trouble.
USDT market cap is about 25% of daily Bitcoin trading volume.
Bitfinex is the biggest exchange for USDT, Bitcoin and Ethereum.
If Bitfinex collapses, that could have the effects of another Mt. Gox - a long term down trend.
Long term outlook:
The long term MACD doesn't look good:
There is the death cross in the weekly macd which usually indicates a long term down trend.
I'm not giving any financial advice. Just be cautious and now more than ever: don't hold more than you're willing to lose.
Most charts are using a log scale: 1-10-100-1000 that shows the percentage change more than the absolute change.