Bitcoin chart: weekly, daily, hourly, half-hour
A look at the weekly, daily, hourly, and half hour Bitcoin chart (Coinbase).
Weekly
.png)
Fractionalizing the range from the April 12, 2021 top to the June 22nd bottom one can see that the latest weekly bar Bitcoin had a strong surge up from the one-half to three-quarter mark.
Daily
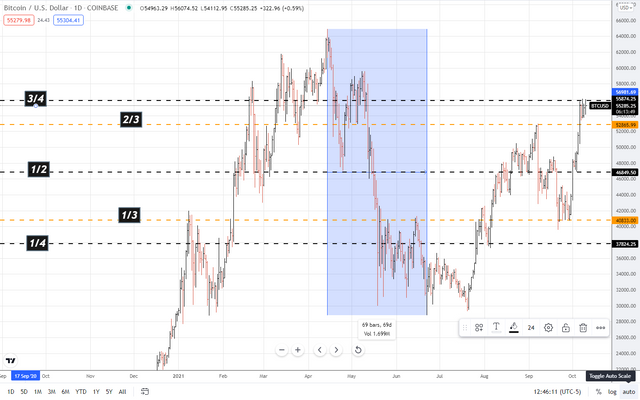
On the daily, BTC has twice in the last three days broken above the three-quarter mark and lost momentum at closing.
Hourly
.png)
56,545.24 was the latest swing top on the hourly printed today.
Half Hour
.png)
With an hourly swing top printed and prices falling I would expect support to be found on the TL of Oct 7 & 8.
.png)
The weekly appears to be strong having broke the September 7th swing top.
.png)
Tomorrow marks the 180th day since the All-Time-High.
.png)
The April-September TL I would look for support should the market turn down.
For informational purposes only. Do your own research. Not trading or investment advice.