Bitcoin Fights Back, But Too Early to Call Bull Reversal
Bitcoin's (BTC) bulls have staged a defense after nearly a month of losses, but a short-term bullish trend reversal is not yet confirmed, the technical charts indicate.
As of writing, the cryptocurrency is up 5 percent at $7,487 on Bitfinex, having clocked a four-day high of $7,560 earlier today.
A minor corrective rally had been expected, courtesy of a bullish price-relative strength index divergence in the short duration charts seen over the last two days.
Further, the resulting bullish outside-day candle engulfed the price action seen on Monday and Tuesday, and has neutralized the immediate bearish outlook.
Daily chart
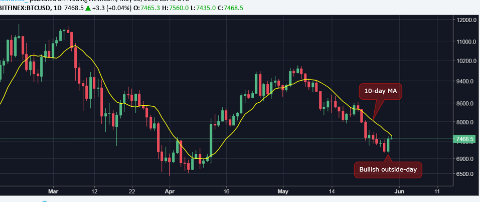
As the name suggests, the bullish outside-day indicates a bearish-to-bullish trend change. However, analysts and traders usually wait for confirmation – positive follow-through before calling a reversal.
So, a short-term bullish trend reversal would be confirmed if bitcoin takes out the descending (bearish) 10-day moving average (MA) hurdle in a convincing manner. Currently, the 10-day MA is located at $7,562 and is capping the upside in prices, as seen in the chart above.
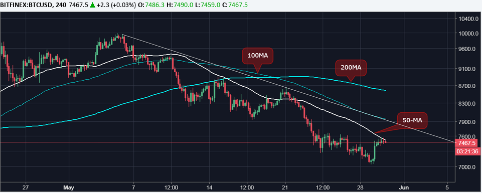
Meanwhile, the 50-candle MA hurdle in the 4-hour chart below is also proving a tough nut to crack.
4-hour chart
![Screen Shot 2018-05-31 at 12.19.04 AM.png]
( )
)
A high volume break above the 50-candle MA of $7,520 could see bitcoin attack the descending trendline hurdle, currently located at $7,930.
That said, prices will likely revisit $7,100 if bulls are unable to cross the key moving average hurdle in the next few hours.
The chart also shows the major moving averages (50,100 and 200) are trending south, a lingering bearish setup. So, a convincing break above the 50-candle MA will be easier said than done.
View
The immediate outlook has been neutralized, but only a convincing move above the 10-day MA of $7,562 would add credence to yesterday's bullish outside-day candle and signal a short-term bullish reversal. In such a case, BTC will likely test the descending trendline hurdle, now seen at $7,930.
The overall bias remains bearish as long as the falling trendline hurdle remains intact
Repeated rejection at the 50-candle MA resistance in 4-hour chart could yield a pullback to $7,100–$7,000.
A break below $6,900 would open up downside towards $5,000, while a move above the recent high of $9,990 would revive the long-run bullish outlook.
Congratulations @jesusbitpro! You received a personal award!
Click here to view your Board
Do not miss the last post from @steemitboard:
Congratulations @jesusbitpro! You received a personal award!
You can view your badges on your Steem Board and compare to others on the Steem Ranking
Vote for @Steemitboard as a witness to get one more award and increased upvotes!