Bitcoin (BTC) Price Analysis July.02
Some thoughts on Bitcoin's recent price action.
Bitcoin's Next Bull Run Underway?
At the time of this post, Bitcoin is testing upper resistance from June's descending channel, reaching a high price of around $6680. In addition, the market has clearly established a support zone around $6300. This zone coincides with the 50 and 100 EMA. The most recent bull run was easily able to break past these two moving averages. During the month of June, these two averages acted as strong resistance levels which provided traders with entry points for short trading.
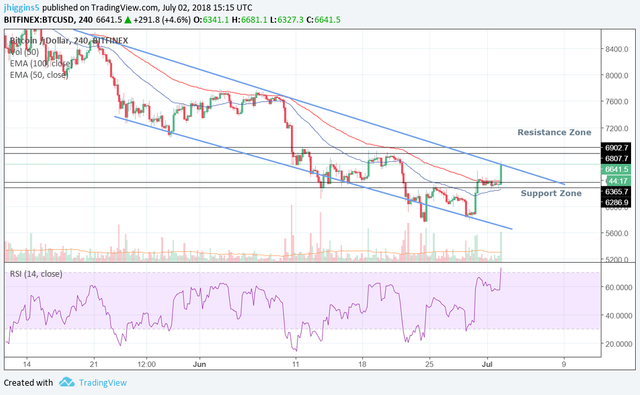
This support zone will prove important as price attempts to retrace from it's most recent price burst. Several indicators suggest an overbought market. Over the next several days, price can bounce between these support and resistance zones as the market attempts to stabilize. A full retrace to the support zone could initiate a Head-and-Shoulders Reversal Pattern, which would provide strong evidence for future bullish movement.
Disclaimer: The information above is for informational and entertainment purposes only and does not constitute trading advice or a solicitation to buy or sell any stock, option, future, commodity, forex, or blockchain-based product. Past performance is not necessarily an indication of future performance. Trading is inherently risky. Please invest responsibly.
upvote for me please? https://steemit.com/news/@bible.com/2sysip