Bitcoin (BTC) Price Analysis July.23
Bitcoin completed a Head-and-Shoulders Pattern last week as investors poured back into the cryptocurrency market. This reversal pattern provides strong evidence for future bullish growth. Investors were able to break above the 100-day moving average to test resistance at $7800.
Bitcoin Retracement Likely
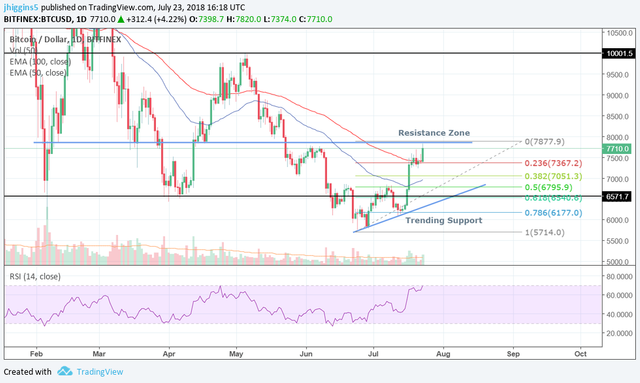
After a strong week of investment, BTC spiked from prices around $6,000 to a monthly high of $7800. Several factors suggest that BTC will once again revisit lower prices before prices reach higher targets:
- Several indicators show that the market is "overbought". Bulls are losing power as bears begin to create selling pressure. The RSI, for example, shows strong evidence that a short-term price reversal is underway.
- Price has successfully reached the historically strong resistance level at $7800. This zone is historically a major zone of support and resistance. As a result, it is an ideal target zone where traders will attempt to take profits from their investments.
- A strong trending support line is established. This suggests that prices could revisit targets below $6800 before finding support for further rallies.
- Key Fibonacci retracement levels correspond with potential support levels at both $6800 (0.5 retracement) and $6500 (0.618 retracement).
BTC needs to find the strength to breakout above the resistance zone of $6800.
Disclaimer: The information above is for informational and entertainment purposes only and does not constitute trading advice or a solicitation to buy or sell any stock, option, future, commodity, forex, or blockchain-based product. Past performance is not necessarily an indication of future performance. Trading is inherently risky. Please invest responsibly.