Bitcoin - This chart looks like it is finally getting ready for a sustained move up!
Looking at a chart of bitcoin over the past year, it finally looks like it has shaken out all the excess.
It had the massive peak just under $20k, which has been followed by 7 months of pullback.
Now the chart is flat lining;
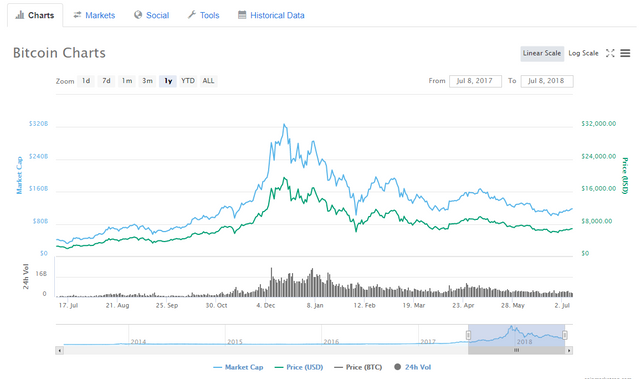
Except in this case, flat lining is actually a good thing.
It means the sellers have finally run out of coins to sell.
Yes there is a lack of demand as well, but we can fix that with some good ol' fashioned ETF approval news which I think is coming within the next few months.
The chart has finally stopped going down, and is not going sideways.
The volatility is completely out of it currently.
Periods of low volatility are followed by periods of high volatility.
We are likely weeks/months away from bitcoin exploding to the upside in a violent manner.
It's go time folks.
Flatline Splatline; we need a rally! 💰💰💰
Patience my corny friend. This process takes time.
https://steemit.com/bitcoin/@steemrise/why-bitcoin-will-act-as-a-safe-haven-during-the-next-financial-crisis
Sure, though I think it goes up whether markets go up or down.