(RP) Bitcoin Long-Term Analysis: February 2018
Not original work
https://trade.cryptocurrents.net/bitcoin-long-term-analysis-february-2018/
Bitcoin price is at a critical juncture between continuing advance and long-term decline. The buy-and-hold investors out there begrudge the prospect of decline. Buy-and-hold investors at Cryptocurrents, who have a more flexible allocation strategy, know that decline brings the prospect of purchasing additional bitcoin at cheaper prices. Similarly, short traders using the MA method have the ability to multiply their bitcoin holdings during decline. This analysis post discusses the prospects and significant signals that will determine our trading decisions during the coming months and, perhaps, during the coming year.
While this post will not apply specific Elliott Wave Principle wave counts to the current chart, it is necessary, as a preface to analysis, to point out the core tenets of Elliott Wave analysis that apply to bitcoin price, as they apply to all market behavior:
The direction of price movement is determined by social mood (market psychology) and not by news or fundamentals
Positive social mood causes buying behavior while negative social mood leads to selling
Positive and negative social mood is not delineated by a stark boundary, instead they are two extremes of a continuim
The swinging pendulum between between positive and negative social mood causes price waves of advance and decline over periods lasting years and decades
This perspective may make intuitive sense to many and it may seem preposterous to others. The notion that price and fundamentals are not correlated is not an idea that fits with common logic, yet it is evident from historical price chart behavior and is only one of the (psychological) contradictions that is explored by the field of Socionomics.
The last point in the bullet above is significant because it corresponds to the principle of Mean Reversion – that price will, for example, periodically return to its 200 day moving average. This notion makes intuitive sense since it is a principle of life and, therefore, human endevor that everything that expands must eventually contract before the next phase of expansion can begin. From here to the chart.
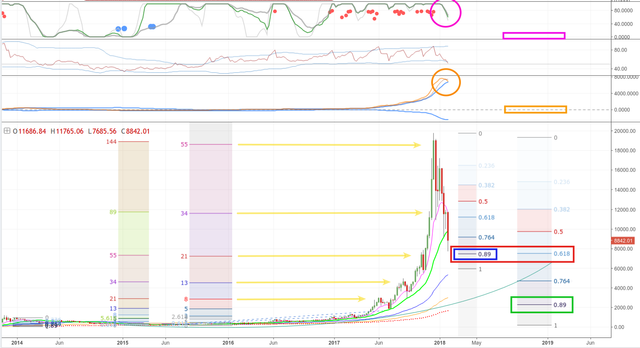
BraveNewCoin Bitcoin Index 1-Week Candle Chart (Linear scale)
(image source https://trade.cryptocurrents.net/bitcoin-long-term-analysis-february-2018/)
The Fibonacci extension tools drawn in the left of the chart are calibrated with the Fibonacci series numbers. With some minor adjustments along the way, these were the targets that Cryptocurrents members traded to during 2017.
On the right there are two Fib retracement tools. One applied to the last wave of advance from $5,300 to near $20,000 and the second, righthand most, tool measures between the closing lows and highs of the entire advance from $200 to $19,000.
At February 3 the 2018 correction has reached the 0.89 retracement level (blue rectangle) of the last wave of advance, which overlaps with the 0.618 retracement (red rectangle) of the entire advance since 2015.
The Advancing Scenario
The 0.618 ratio is important since this is a psychological ratio that the human mind is consistently attracted to. Many of you will be aware that 0.618 is called the “Golden Ratio” (or “Phi”) since it forms the mathematical basis for plant structure, spiral galaxies, etc and manifests in cultural phenomena such as art, music and even the proportions of the human body. In his book “The Wave Principle” (1948), Ralph N. Elliott proposes that 0.618 must be integral to market psychology since it manifests as a ratio in most price wave relationships. Cryptocurrents members have seen this ratio manifest repeatedly in the bitcoin price chart during the past 3 years. And here we have it again.
So, what does it mean? Potentially, we are looking at a bottom for the current correction. If this turns out to be the case, then we expect to see at most a new negligible low (above $7000) and for price to advance toward the previous top. It may or may not make a new all-time high but let’s call this case “the Advancing scenario” – to be explored further down the page.
Should the Advancing scenario develop into another wave of advance to new all-time highs then we have Fibonacci extension targets at $30k and $50k (not visible in the chart, above).
The Declining Scenario
Achieving 0.618 retracement does not guarantee trend reversal. The 0.618 level may simply be an intermediate reaction zone before decline continues. In this sense the 0.618 retracement level near $7,500 is a watershed between renewed advance and continuing decline.
The bearish case is compelling in the 1week chart. Note that MACD has turned below its signal line and is about to cut below its upper Bollinger Band (orange circle). Given the sheer scale of the 2017 rally, other examples of MACD behavior at large corrections have been dwarfed beyond visibility. Study of MACD behavior shows that large corrections typically only bottom out once MACD reaches its zero line (orange rectangle). The same behavior applies to the stochastics (magenta circle) that will seek to reach their minimum value toward the end of a large degree correction.
The bitcoin price chart is full of examples where rallies had been corrected to 0.89, i.e. almost 90% of their entire distance. If this declining scenario turns out to be the case then we should eventually see price make a bottom near $2,000 at the green rectangle.
“How could this possibly happen?” you might ask. “Bitcoin is an unprecedented innovation, scaling has been solved. As adoption grows and with ever increasing demand its price can only go up!”
This argument assumes a conventional understanding of supply-and-demand (limited supply, ever increasing demand) and that fundamentals (solid security, exemplary developer brain trust, effective scaling solution) is what drives price higher. Is this objectively and provably true?
What Drives Price?
Consider that during the period January 2014 to January 2015 there had been an explosion in Bitcoin adoption. Despite a Peoples’ Bank of China ban on bitcoin transactions with banks and the implosion of the Mt.Gox exchange, the number of bitcoin transactions increased during the period, as did the number of new exchanges and new exchange account applications (especially in China). The number of businesses accepting bitcoin increased during the period with Overstock.com, Gyft.com and Dell experiencing lucrative bitcoin sales. Several dark market operators replaced the defunct Silk Road to meet the massive demand for illicit goods. In other words, adoption and use of Bitcoin increased during 2014.
Yet, price continued to decline throughout.
The point being illustrated is that adoption, utility and fundamental factors do not “cause” price to advance in their own right. What causes price to go up and down is buying and selling. In other words, regardless of fundamentals, the driver of price is Speculation. Think about it: despite dismal (and weakening) fundamentals, Ethereum has been in a long-term rally!
If the bulk of the market is buying then we see price advance. If the bulk of the market, during a period of negative social mood, engages in selling behavior, then we see decline and ever increasing bearish technicals. Hence, long-term trend is determined by the social mood of speculators.
How do we determine or measure social mood? This is a complex social phenomenon with certain tell tale signs. Social mood can be positive in one country and negative in a neighboring country. Mood can be positive in one community and negative in another. As we have seen in Bitcoin, with the scaling debate, it is possible for factions within the same community to manifest opposing moods. As for the dynamics and signs of social mood I will leave you to read the content at Socionomic.net. As for the signs of social mood applicable to this discussion, the example of attitudes toward institutional and Wall Street interest in Bitcoin illustrates the phenomenon.
Same Facts, Different Attitude
During 2016 and 2017 the Bitcoin sub-Reddit was awash with posts showing how institutional interest in Bitcoin (and “blockchain tech”) was increasing. Every developer commit to SegWit and Lightning Network was celebrated and discussed with joy and vigor. Every mention of Bitcoin in mainstream media was a victory and redditors applauded the increasing interest and adoption by the finance world. When the CME announced Bitcoin Futures, social mood resembled a collective orgasm despite the fact that CME futures involve no actual bitcoin and never settles to the blockchain, neither directly nor via an exchange. The positive social mood fueled a stupendous rally toward $20,000.
Now, on the other side of the blow-off top, the rhetoric has changed: “Wall Street is shorting Bitcoin into the ground to destroy it”. Some commentators argue that Lightning Network is taking too long to deploy and that layered scaling has cost Bitcoin its network effect and utility. More and more twitter posts allege that Lightning is just a sham by Blockstream to centralize Bitcoin to itself and the banks for profit. Resentment and distrust is growing… imagine the many new hopefuls who bought in from $7k to $19k, and those individuals who had mortgaged their houses to go all-in at $10k or $15k BTC/USD.
While those who bought near the start of the rally are taking profit, those who bought big during the blow-off rally are becoming angry at bitcoin for their losing position and low morale. This is how negative social mood exacerbates and selling behavior becomes more prevalent.
Outlook
Perhaps the 0.618 retracement level near $7,500 provides a support layer for renewed advance. However, if it fails – now or later – the declining scenario can result in prices near $2000 (0.89 retracement) according to the social mood dynamics discussed above.
As flexible traders and investors we realize that we are in a dynamic market. To benefit from the cycles of advance and decline we only need to analyse the chart, determine trend via the moving averages, and then trade in the direction of trend while it lasts. The next chart will look at historic trend and what we can expect going forward.
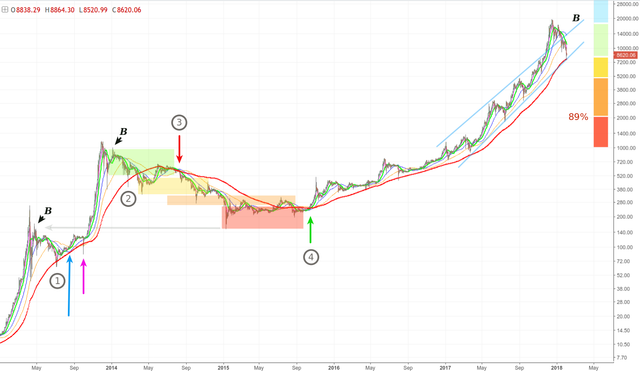
Bitstamp 1-Day Candle Chart (log scale)
(image source https://trade.cryptocurrents.net/bitcoin-long-term-analysis-february-2018/)
Advancing Scenariuo
The left of the chart shows the two advancing price waves that led to the 2013 top near $1,260. Note that the 200 day MA had served as support at circled label “1”. Should advance resume from price’s current (2018) position at the 200 day MA, then we’d expect it to push above the 200 day MA in the coming weeks and for a 1day MA Buy signal to be confirmed at the 4hr timeframe prior to strong advance to $30k.
Since price has now reached the 200 day MA – and the 0.618 retracement level – we expect an advancing wave anyway. Let’s consider the price action at circled label “2”. Price declines to the 200 day MA and then returns to the 50 day MA (blue). At the time of writing the 1day 50MA is descending through $13,500. Should advance target this MA then it should reach it at approximately $13,000. Continuing advance above the 50 day MA would herald the Advancing scenario mentioned above.
Declining Scenario
Reversal at the 50 day MA would print a lower high and form what is called, in Elliott Wave terms, a “B wave”: a bull trap prior to a return to decline. Other examples of B waves are labeled with a black “B” in the chart.
The probability that we see a B wave unfold from $7,500 toward $13,000 is high because of the bearish indication of the 1week chart’s MACD. The weight of probability leans toward ongoing decline – with upside fake-outs – until 1week MACD has returned to zero. Yet, there is nothing stopping price from resuming advance sooner and pulling 1week MACD out of its dive. This observation about MACD behavior is presented as a probabilistic indicator that will be more useful if we see ongoing decline below the 200 day MA.
Notice how, once price and all the MAs decline below the 200 day MA (at label “3”) relentless decline follows. Similarly, only once price and the MAs advance above the 200 day MA does advance accelerate (label “4”).
200 Day MA is Critical to Trend
The 200 day MA is, therefore, critical to trend and price periodically returns to it. Whenever price moves too far from the 200MA it tends to snap back to it violently. When price crosses the 200MA and establishes trade there then that is a strong confirmation of long-term trend change.
The colored bars in the chart are not of much significance but only drawn to show that large declines unfolds in stages. Various support and resistance zones need to be negotiated and price tends to revisit previously negotiated zones during upward corrections. For this same reason we are likely to see price revisit the $9,000 and $10,000 zones (or higher) now that the upper boundary of the $7,500 zone and the 200 day MA have been hit.
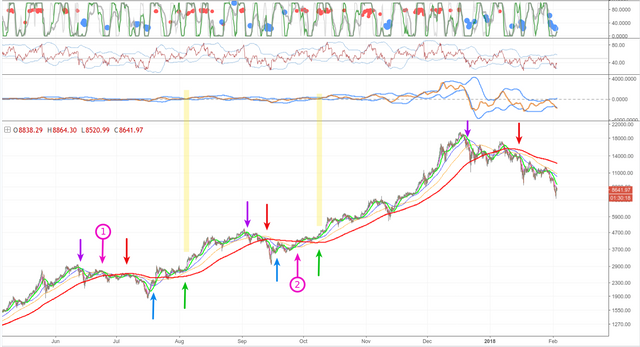
Bitstamp 4-Hour Candle Chart (log scale)
(image source https://trade.cryptocurrents.net/bitcoin-long-term-analysis-february-2018/)
This 4hr chart study seeks to illustrate the action of the 4hr MAs both going into decline and following completion of a correction.
Purple arrows (above price) are drawn where price initially declines below a 4hr 20/50MA cross-over. As explored in the previous section, notice that decline intensifies once price and all the MAs decline below the 4hr 200MA (red arrows).
The magenta arrow at label “1” points out a second 20/50MA cross-over (to the downside) that only sees weak decline – precisely because it occurs above the 200MA.
4-Hour Advancing MA Behavior
Once the decline is over and price reverses to the upside, there is a typical and repeating pattern of price behavior in relation to the 4hr MAs. The blue arrows point to the initial 20/50MA cross-over (to the upside). Note that it occurs below the 200MA and that price snaps back to the 200MA once it has been crossed by a small distance. At the green arrows advance accelerates as the faster MAs advance above the 200MA and MACD pushes above zero (horizontal yellow bars). Again (magenta arrow 2) points to a second 20/50MA cross-over that is retraced because it occurs below the 200MA and before MACD has pushed above zero.
Conclusion and Outlook
We only seek to rejoin trend once we see a confirmed 4hr Buy signal form above the 4hr 200MA. This spares us from upside fake-outs, and at the current location in the chart, from a potential “B wave” fake-out to the upside.
The 4hr 200MA is currently descending through $12,500 in the Bitstamp chart. Even if price advances above it, the study above shows that, we do not need to take any upside action until we see a confirmed 4hr Buy signal form above $12,500. If it does, then we know that this will be for an advancing wave through the 1day 50MA near $13,000.
https://trade.cryptocurrents.net/bitcoin-long-term-analysis-february-2018/
#bitcoin #cryptocurrency #blockchain
Its good that the market would go down for a while so it could get more buyers
thats right, gives people some confidence.