Bitcoin overview on the chart
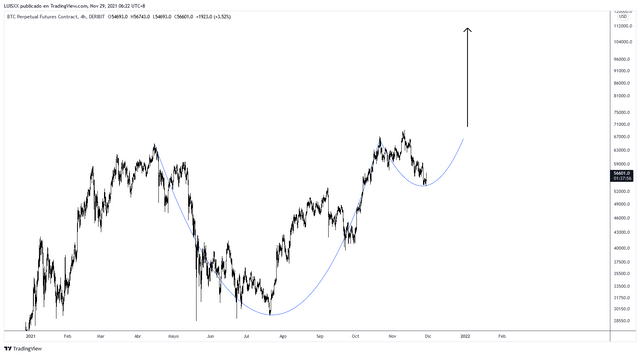
In the image above we can see how the market is forming the bullish figure known as cup & handle, a highly relevant chart figure in a bull market.
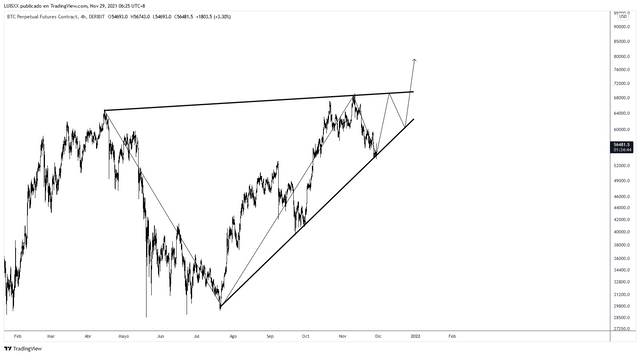
In the image above we can see the formation of a bullish triangle that should push the price in an upward direction once we have made the next HH of the trend formed within the triangle.
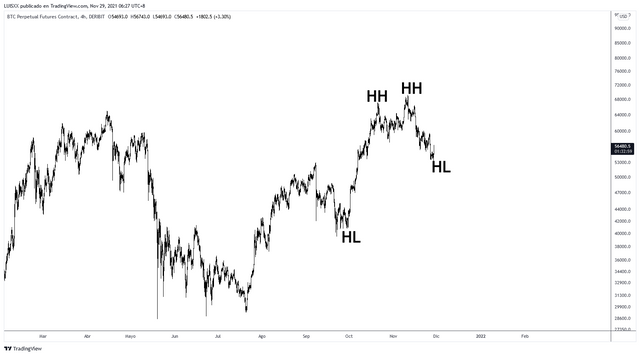
In this other image I have placed the "nomenclature" to observe how the price in its path has been forming higher and higher highs and higher and higher lows, a clear observation of how the uptrend continues its course.
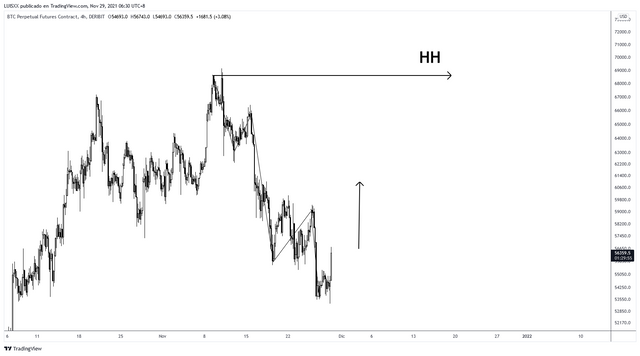
In the image above we see that the current downward wedge correction has found support, therefore, the price should not take long to make the next impulse towards the ATH, this way we would have the third HH of the triangle, hence, a next and last correction before proceeding to the break of the triangle resistance and continue with a strong bullish move for the beginning of the next year.
In conclusion: the Bitcoin market is stronger than ever, the uptrend remains strong, currently finding support at $54K, now the price must go in search of the $68K resistance, before looking for the breakout of the figure and being able to look for higher price levels.