$9K Ahead? Bitcoin Looks North After Bull Breakout
Bitcoin (BTC) looks set to extend its two-day winning streak and could soon test the $9,000 mark, technical analysis suggests.
Over the last two days, bitcoin has retraced close to 30 percent of the recent drop from $11,660 (March 5 high) to $7,335 (March 18 high). Further, the cryptocurrency also witnessed an upside break of the key descending trendline yesterday. So, it appears the world’s largest cryptocurrency by market capitalization has bottomed out for the short-term.
However, despite the bull flag breakout, the cryptocurrency has been restricted to a narrow range of $8,200-$8,700 for the better part of the last 20 hours.
Trading volume in the last 48 hours has stayed around the monthly average of $6.64 billion, as per CoinMarketCap, which is a slight cause for concern. A big rise in the trading volumes would have meant the recovery in BTC is backed by strong hands.
Still, the price chart analysis indicates BTC is possibly a building base around $8,200 for the next move higher towards $9,000.
As of writing, the cryptocurrency is trading at $8,448, according to CoinDesk’s Bitcoin Price Index (BPI). The global average price, as calculated by CoinMarketCap stands at $8,498 – up 2.8 percent in the last 24 hours.
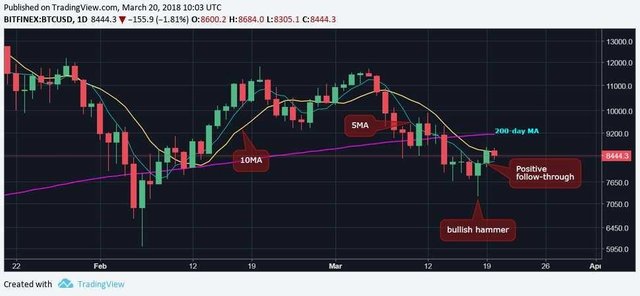
Daily chart
The above chart (prices as per Bitfinex) shows:
Short-term bulls reversal as indicated by Sunday’s bullish hammer and Monday’s positive follow-through.
BTC closed (as per UTC) above the 10-day moving average (MA) on Monday, indicating scope for short-term consolidation with a positive bias.
Both the 5-day MA and 10-day MA have bottomed out (shed bearish bias).
Major resistance is seen at $9,157 (200-day moving average) and major support is seen at $7,665 (March 15 low) and $7,240 (March 18 low).
4-hour chart
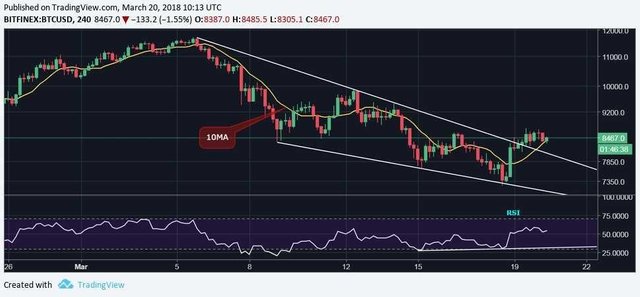
The bullish RSI divergence followed by an upside break of the falling wedge further adds credence to the short-term bullish reversal as seen in the daily chart. Also, the 10-MA is biased to the bulls.
View
BTC will likely test $9,000 (psychological hurdle) and $9,157 (200-day MA) in the next 24-36 hours.
A daily close above the 200-day MA would open the doors for $10,000. Currently, further gains are ruled out, as suggested by the bearish weekly chart.
On the downside, a move back inside the falling wedge would signal bullish invalidation.
A daily close (as per UTC) below $7,240 (March 18 low) would revive the bearish outlook.
INDONESIAN
$9K ke depan? Bitcoin terlihat Utara setelah Bull Breakout
Bitcoin (BTC) tampak mengatur untuk memperpanjang streak menang dua hari dan bisa segera tes tanda $9.000, menunjukkan analisis teknis.
Selama dua hari, bitcoin telah kembali dekat dengan 30 persen drop hari dari $11,660 (5 Maret tinggi) untuk $7,335 (Maret 18 tinggi). Lebih lanjut, cryptocurrency juga menyaksikan upside break kunci menurun trendline kemarin. Jadi, tampaknya cryptocurrency terbesar di dunia menurut kapitalisasi pasar telah dipercaya keluar untuk jangka pendek.
Namun, meskipun pelarian bendera banteng, cryptocurrency telah dibatasi untuk berbagai sempit dari $8,200-$8,700 untuk bagian yang lebih baik dari 20 jam terakhir.
Volume perdagangan dalam 48 jam terakhir telah tinggal di sekitar rata-rata bulanan sebesar $6,64 miliar, seperti CoinMarketCap, yang merupakan penyebab sedikit perhatian. Peningkatan volume perdagangan yang besar akan berarti pemulihan di BTC didukung oleh tangan yang kuat.
Namun, harga bagan analisis menunjukkan mungkin Mall BTC merupakan sebuah bangunan dasar sekitar $8,200 untuk langkah berikutnya yang lebih tinggi terhadap $9.000.
Seperti tulisan, cryptocurrency trading pada $8,448, menurut Indeks Harga Bitcoin CoinDesk's (BPI). Harga rata-rata global, seperti yang dihitung CoinMarketCap berdiri di $8,498-2,8 persen dalam 24 jam terakhir.
Grafik harian
Grafik di atas (harga per Bitfinex) menunjukkan:
Pembalikan bulls jangka pendek seperti yang dikatakan oleh palu bullish hari Minggu dan Senin positif tindak lanjut.
BTC ditutup (sesuai UTC) di atas 10 hari moving average (MA) pada hari Senin, menunjukkan lingkup untuk jangka pendek konsolidasi dengan bias positif.
5 hari MA maupun MA 10 hari telah dipercaya keluar (gudang bearish bias).
Resistensi utama terlihat pada $9,157 (200-hari rata-rata bergerak) dan dukungan utama terlihat pada $7,665 (Maret 15 rendah) dan $7,240 (18 Maret rendah).
Bagan 4 jam
Perbedaan RSI bullish disusul upside istirahat baji jatuh lebih lanjut menambah kepercayaan pembalikan bullish jangka pendek seperti yang terlihat pada daily chart. Juga, 10-MA bias untuk lembu.
Pemandangan
BTC akan menguji $9.000 (psikologis rintangan) dan $9,157 (200-hari MA) dalam waktu 24-36 jam.
Dekat harian di atas 200-hari MA akan membuka pintu untuk $10.000. Saat ini, lebih lanjut keuntungan yang memerintah, yang disarankan oleh chart mingguan bearish.
Pada sisi negatifnya, bergerak kembali ke dalam baji jatuh akan sinyal bullish penghapusan.
Dekat harian (per UTC) di bawah $7,240 (Maret 18 rendah) akan menghidupkan kembali prospek bearish.