BITCOIN "When do the big fish eat the little ones?" BIG PICTURE ANALYSIS / LOGARITHMIC CHART FROM 2013 - 2018

Hi Steemers,
After yesterday's news of the collapse of the Bitconnect platform (the most popular and biggest lending platform) pushed the markets down a notch. Now, it's time to analyze how far this big correction in Bitcoin will last as it peaked in December at almost 20 000, - USD.
The Cryptomaerkte are generally not always very easy to access with the charting technique. There are many influence vectors that are very peculiar to the crypto market. These would be for example ...
- There is a lack of transparency because there are no regulated exchanges
- Many medium-sized exchanges spread around the world determine the price of Cryptos
- There is hardly any way to secure your positions (except tether which is controversial), yes and Bitshares :-)
- There are still more unprofessional investors on the move than big professional investors
- All Crypto Exchanges are calibrated on Bitcoin that complete trading system is constructed on the Slug Horse Bitcoin
- All Altcoins are sometimes less dependent on Bitcoin prices
- And many more points ....
One way to get meaningful information out of this tangle is to look at the statistics!
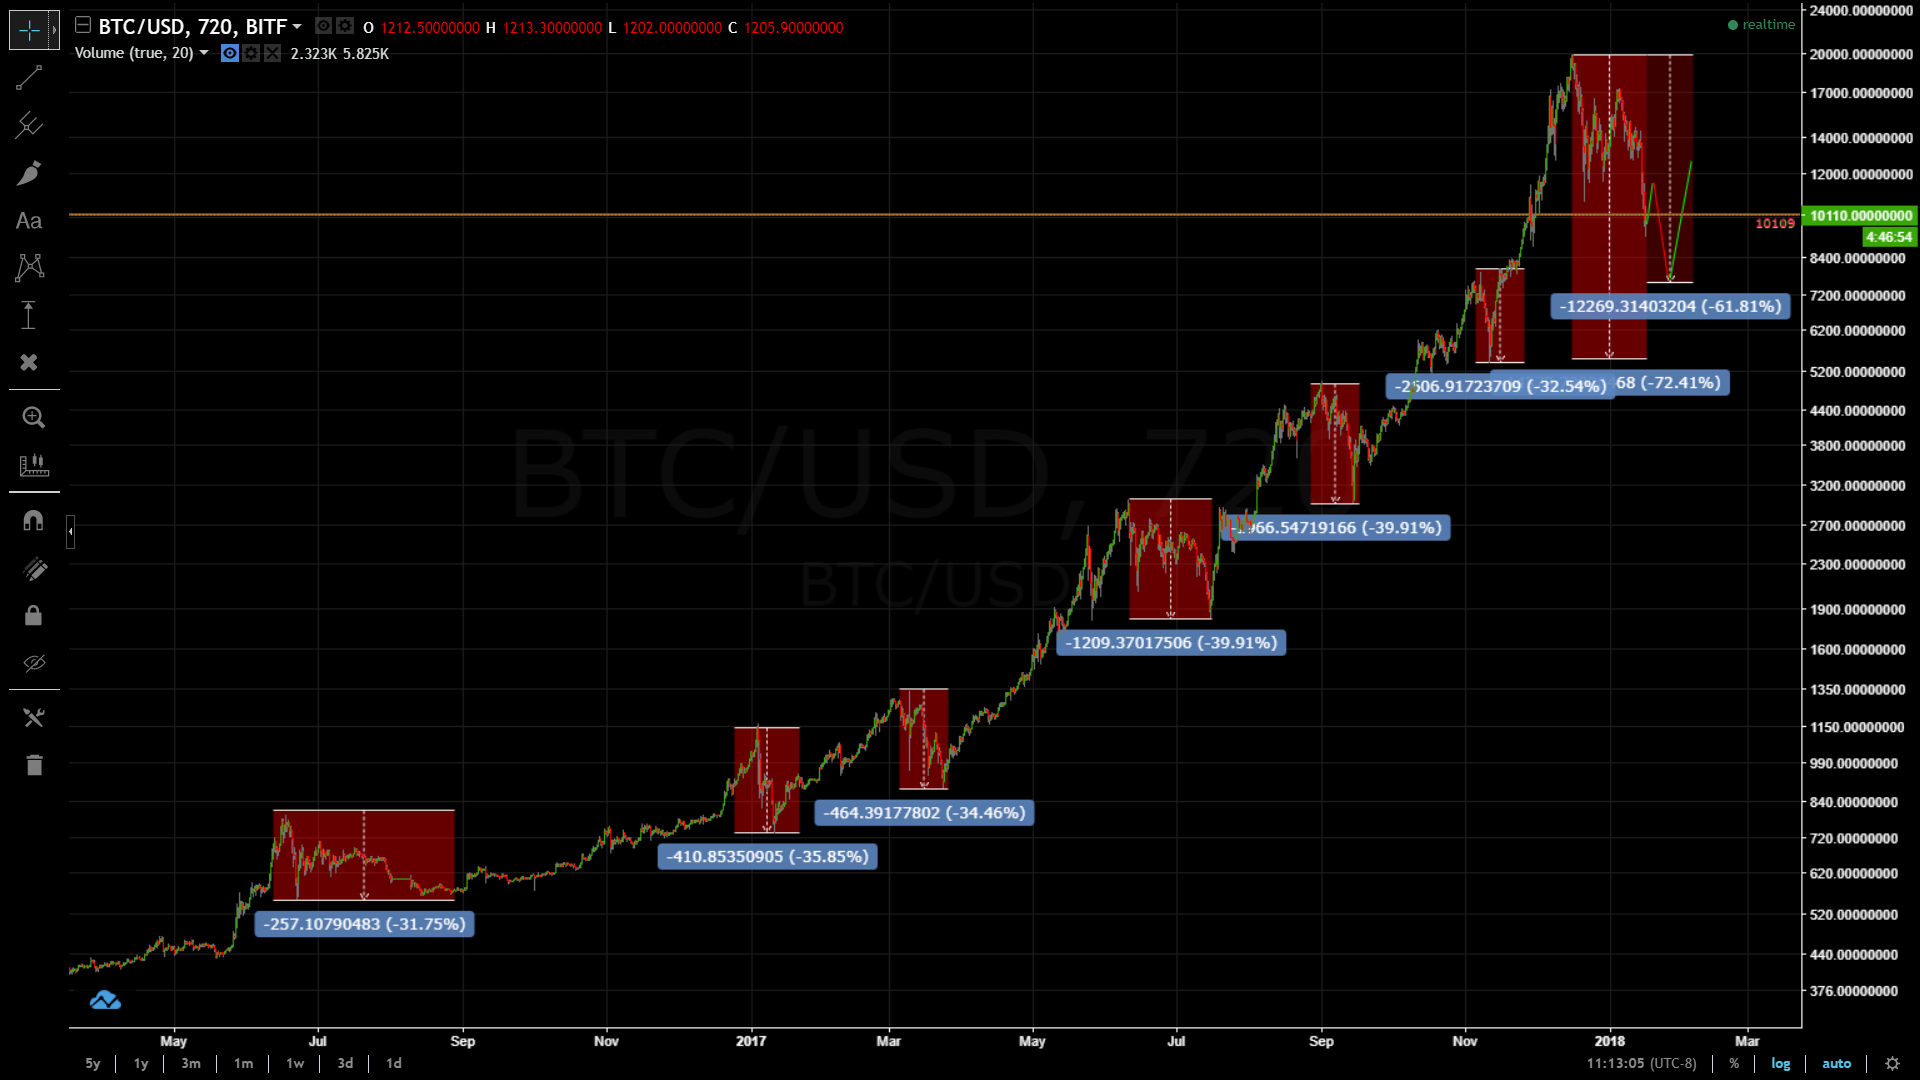
So, since September 2013, I've examined the complete chart of Bitcoin to see how big (in percent) the last corrections in Bitcoin have ended.
For this I used a logarithmic chart. This always measures only the percentage increases or decreases compared to the linear chart. The linear chart scales upwards on the dollar bearer and the logarithmic chart scales upwards in percentage difference. An example would be that the jump from 10, - $ to 20, - $ in the logarithmic chart has the same size as the jump from 1000, - $ to 2000, - $. Moreover, it is possible for me only in the logarithmic chart to look so far into the past without the overall picture looks distorted.
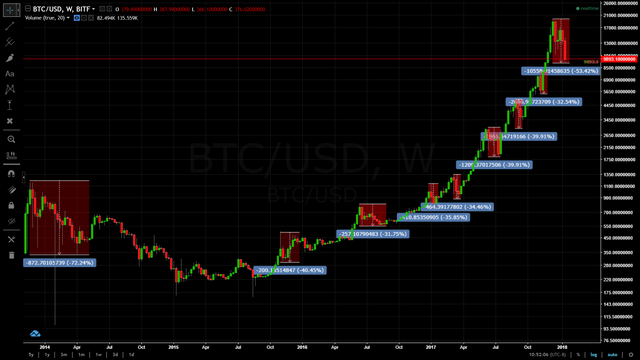
Here is a comparison: (Zoom-In -> you can hold "ctrl" and move the mouse wheel)
Bitcoin Linear Chart from 2016 May to 2018 (One candle = 1 week)
Bitcoin logarithmic chart from September 2013 to 2018 (One candle = 1 week)
What insight do we draw from this chart?
We can hold the following ->
- Since the year 2016, the most recent corrections in Bitcoin have been between 31.75% and 40.45%
- At the end of 2013, the biggest correction was 72.24%
-> We are already above the average of the last corrections with approx. 53.42%
- In terms of time, we are still on average with 5 weeks, but this takes more time than the last five corrections.
-> From this I conclude if we are already in the price and time range over the last five correction phases then Bitcoin has changed something fundamentally in the market.
And in fact, since the beginning of December, we have seen a fundamental turnaround in potential market activity with the introduction of Bitcoin Futures. To get back to the title of my post "When do the big fish eat the little ones?" is meant that just since the beginning of the correction presumably larger investors are on the way to try the market to pressure and then buy in later at a cheaper price.
Let's also consider that big investor need a "selling climate" to acummulate big buying positions in the market. Because in the steady upward trend sells hardly take place and therfore the big guys aren't able to get in! (Without pushing the price up to much)💡
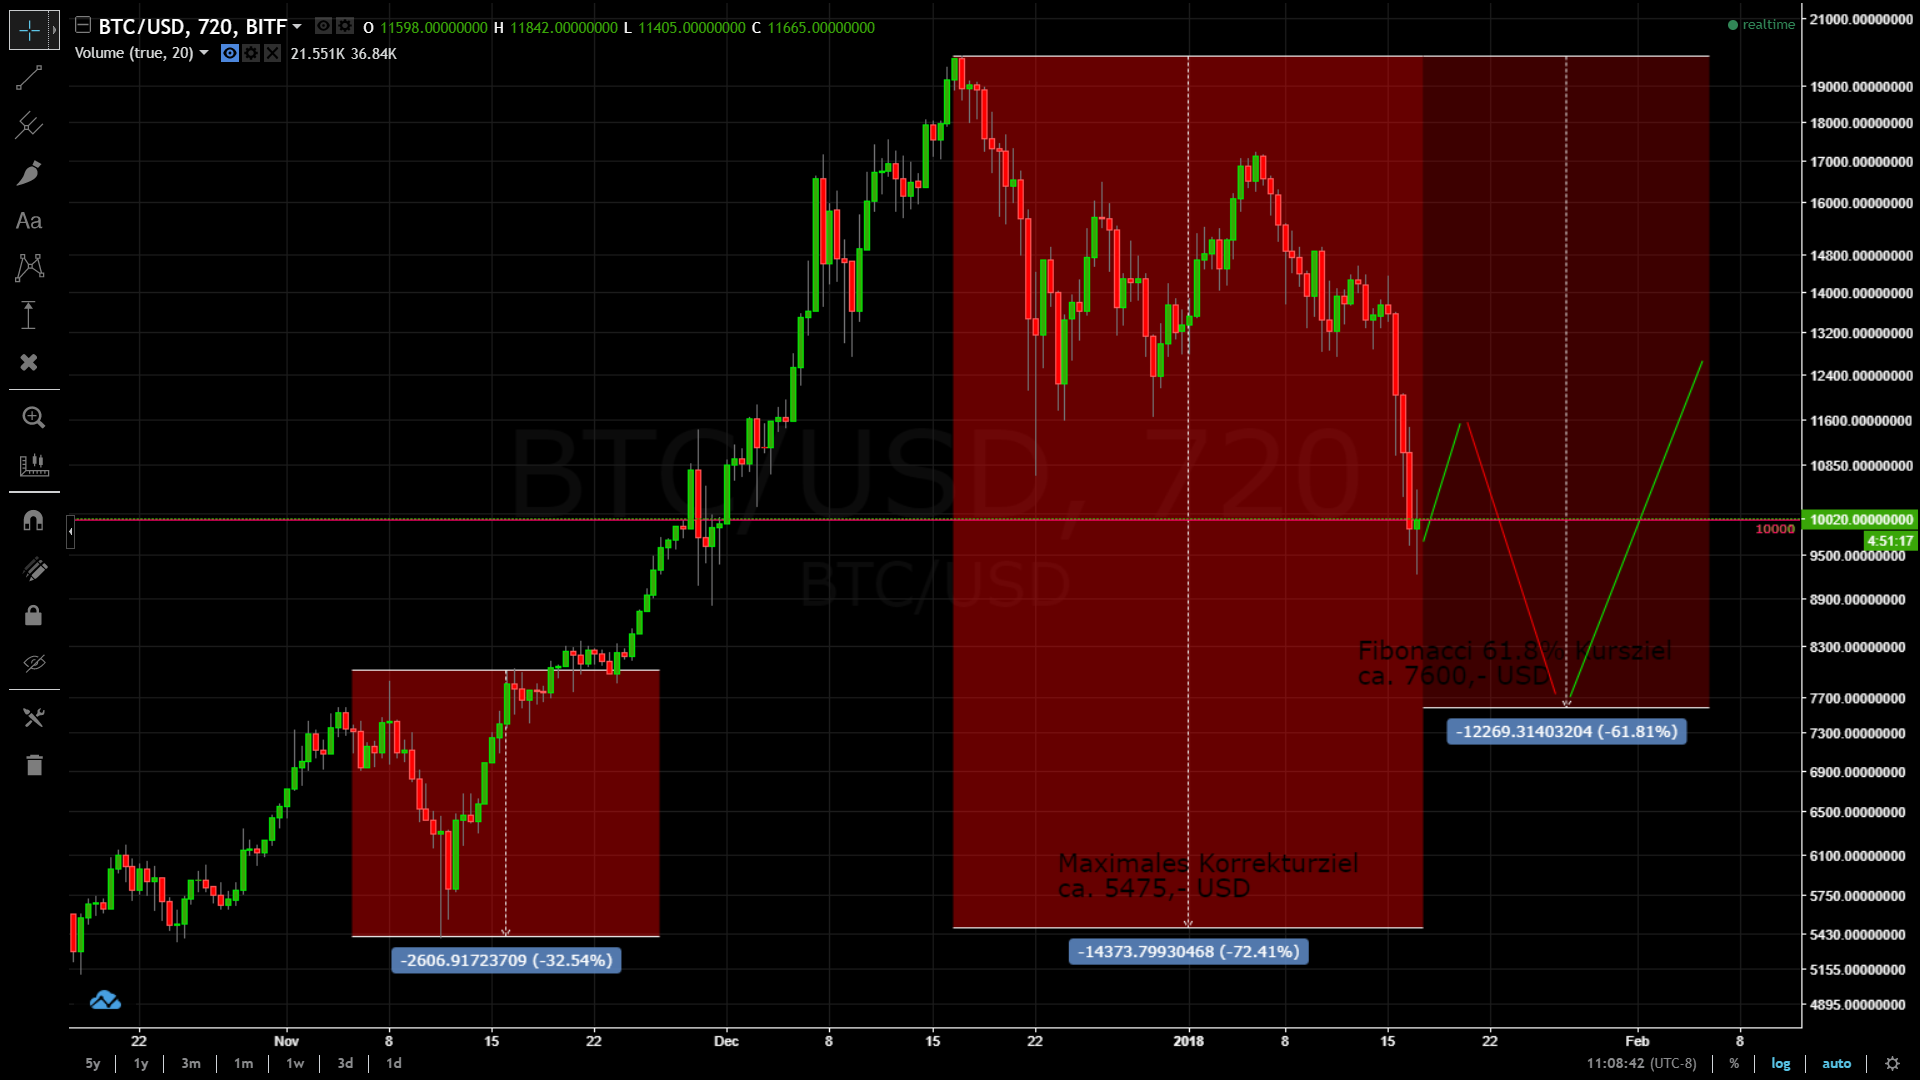
Therefore, I have now taken the big correction from the end of 2013 with 72.45% and used this as a reference value for our current situation. This chart was created.
We can see that under these conditions the maximum correction target is approx. 5475, - USD, If that happens then we would have seen a real panic in the market and the market would be considered adjusted at that time. If it does not happen, what I'm expecting, then we could take the 61.8% Fibonacci retracement at the next price target approx. 7600, -USD.
This Variant I would currently prefer, but there is still the possibility that we stop right now at the current 50% correction and start to move back up again.
My conclusion:
The market has a risk potential of first 7600, - USD from here increased chances that the market will bottom and starts a new up-move. The first positions can already be staggered if the market surprisingly moves upwards. The maximum possible correction target would be $ 5475 USD.
Keep the ears stiff dear Steemers. This week will remain turbulent at the Cryptomarkets!
I look forward to your comments, ideas and questions.
Until then, all the best,
your @masterthematrix
Recommended Tradingplatforms:
Binance:
Very good coin selection / most ICO coins are listed. Very low trading fees (0.1%) and especially with BNB Tokens (0.05%). Very user-friendly Interface and it offers are Referral Program, feel free to use it.
Binance
Coinigy:
Professional Tradingplatform where you can import all API-Keys from other Trading Accounts. You can manage and trade all of your Accounts from Coinigy. Very professional Trading Platform with various options of paid extra Services. Coinigy also has a Referral Program, feel free to use it.
Coinigy
Boost your Votes with Steemfollowers: Steemfollower

good charting ;-) But in my opinion logcharts are only useful to gather a more complete image of the big picture. This is what you used it for here.
There will always be big corrections from time to time. It has to be this way. Investors do not buy at such elevated prices and when there are suddenly no buyers left, it drops again...
Thanks for your good feedback, I totally agree that we need to have corrections in the market. They are good because they help professionell investors to manage their risk. Big support zones like Bitcoin 5000,- USD is crucial for big investors to manage Risk otherwise there would be no chance of entering this Market.
Many thanks for this interesting post!
We really appreciate it, that most of your posts are also translated!
Agree! I have buy orders at 5000 to 9000
Thanks for your great analyse! @masterthematrix 👏
...it definitely will be an interesting year!
Resteemed!
...keep posting!
your @mynaturebody 🌱
What do you think? @cleverbot
You are.
Bitcoin price prediction? @cleverbot
I think you're being a little innapropriate.
Why innapropriate? Do you have an opinion about crypto currency markets?
Yes. I think you are beautifully arrogant.
Everytime I tried using traditional indicators for cryptos, they surprise me by doing something different... But today looks good.. thank for sharing @masterthematrix.. :)
I really hope this (future und fear related)correction will soon find an end :/
Thanks for sharing this intersting comparisons! Good job!
Oh, I really hope that we don't see corrections of that magnitude. The psychological thing that I hope is going to work in our advantage here is the fact that there are many people out there who were considering getting in to Bitcoin and cryptocurrency in general so this current dip is going to allow them to start buying at more affordable prices. This will hopefully push the price up before it crashes so low.
I think we're seeing that a bit already and I hope to see higher values very soon.
Thanks for your comment, yes I think we will have a very good year 2018 and there are definitely more gains to come. But still, we have to deal with some more risk in the market for example regulations all over the world are tightening. So just be aware that we might see another dip in the price movement and when we hit 7 600,-$ then You will know that this is a great time to buy and to get in. I wish us all a happy rollercoaster ride!!!
good post, thank you
Wow this really helps a lot! Thank You!!!