Bitcoin Price Predictions 31st January 2018
Bitcoin Analysis Today
Bitcoin is still trading in a range of symmetric triangle which was spotted in the previous analysis.
The current market price is 10200 and it is the rising support area of a triangle. As bitcoin is respecting its support areas from a couple of days, so the chances are it may bounce again from this area towards its resistance level 12800-900.
Please keep in mind once this channel will break it could give very fast and volatile move for at least 2500 to 3000$ either upside or downside.
If the price break upside or resistance, it can touch 15000$ again and the resistance zone is 12800-900.
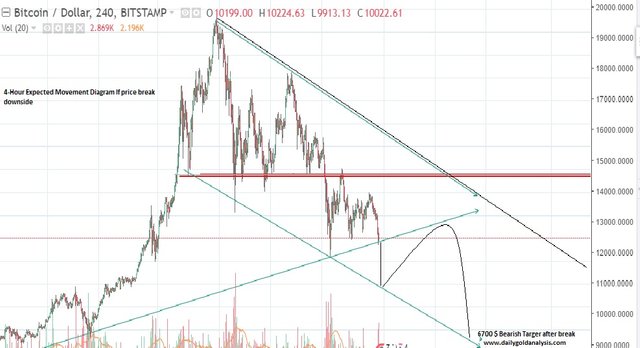
If price breaks its support level then most probably it will fall to the minimum 6700$ Level.
How to trade the symmetric triangle :
Buying from the support and selling from the resistance is the basic concept of trading triangles. But when the price comes narrow, then we should wait for the break of a triangle to jump in for the big move.
9200-300 level is the break confirmation level, if the price break and close below this level this will be the confirmation of triangle downside break and in this scenario, the support will act as a resistance to next movement and we will set minimum target level 6700 $ as per the technical calculations and our stop loss should above the broken support area 9300$
If the price breaks its resistance level 12800-900 and closes above the resistance line which is mentioned in the bitcoin chart below then this will be the earliest indication to jump in for the bullish rally towards 15000$ minimum.In this case, our stop loss should below the broken resistance line 12800.
Note: when we use the break and close then it means we have to wait for the candle closing of that time interval.because sometimes price breaks the support or resistance but comes back in a range at the time of the closing candle. so we will only consider a break when the price will close above or below the support resistance level.
Please have a look at 4-hour chart below, I have created 2 different charts for bitcoin expected analysis today.
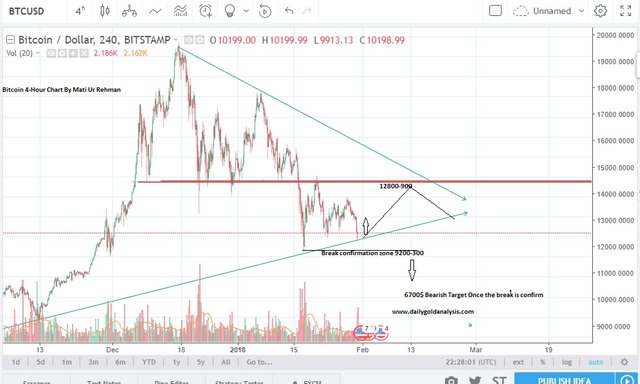
Bitcoin 4-Hour Chart
Expected Movement Diagram If Bitcoin Breaks Its Support Level
Bitcoin Price Forecast 4-Hour Chart 31st January 2018 Expected Move
Bitcoin Suppor & Resistance Levels
Support 1: Current Market price
Support 2: 9200
Resistance: 12800-900
IF IT DROPS TO 6700 ISH THATS GONNA BE INSANE LOL
That's the technical point of view.If price breaks its support level then 6700$ may be the next bearish target.
best cryptocurrency till now. hopping for best :)
Thanks for the graphs ..hope it corrects soon!
looking farward