BTC Triple Bottom, False Breakout - where next?
I have been trying to find out where we are in the market, with so much good news and higher amounts of investment in the crypto industry than there has ever been, why is the marketcap so low at the moment? Where are we in the market cycle?
I do not claim to know where we are, but I know that there are companies that study cycles for a living.
An example is Abbott Futures. They have published a PDF called The four most reliable technical indicators. The document looks at triple bottoms mainly, but since the BTC market is currently in this cycle, it is worth looking into.
You can take a look at the document yourself, but I have extracted parts that I think are worth summarising:
"Traditional charting techniques tell us that it is a good idea to buy on a retest of multiple bottoms and sell on a retest of an area of multiple tops. After all, it appears only logical, but often wrong, that if these areas held in the past, they should be able to hold in the future. "
"According to traditional thinking, a protective sell stop is then placed just below the multiple low levels or a protective buy stop is placed a little above the highs of the multiple top area. "
Basically this implies that traders, often protect from losses, by placing stops just below a strong support. Thus, it can be implied that most traders will have a similar protection in place.
" In fact, it is more likely that a quadruple bottom will be penetrated on the downside rather than the double bottom or the triple bottom, since the more times a particular area of support has held in the past, the more likely there will be a large accumulation of sell stops just under the lows. The inverse is true for quadruple top patterns."
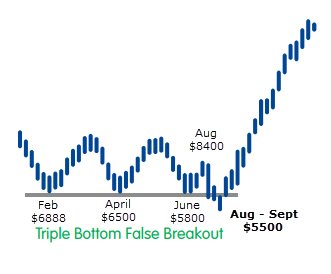
Basically this is the scenario we have, in BTC. Currently we should expect traders to set up stop losses under $6000, $5800 and perhaps $5500. Since we have seen $5800, it is likely there is an accumulation of sell stops below this level.
"Very often it is only after a clear and obvious area of “rock solid” support or resistance is taken out that futures can reverse after an extended move in either direction. A market often will bottom after the very last and often the “best” chart support area has been taken out and the chart pattern looks horrendous. In this situation, the “last of the longs” have finally given up."
"Very often it is only after the longs have been liquidated, after being completely demoralised when the last and most obvious support could not hold, that futures can begin a new up leg."
The document also references a chart with a triple bottom false breakout, I have overlayed BTC prices, to best match chart pattern.
What do you think? Do you think this indicator is reliable for the BTC Market?
Thank you for the simple and easy post https://9blz.com/triple-bottom-pattern/