Bitcoin's Next Big Move Will Happen on This Date!
Hi Steemitian,
Hope you're well and welcome to this update on Bitcoin. In this post, I'm going to show you something very interesting and actually incredibly fascinating. I'm gonna explain when Bitcoin's next big move will happen!
Alright, guys let's take a look at this chart of Bitcoin. Now as you probably know Bitcoin has hit a key level. Key level is the 61.8% Fibonacci retracement. You'll see that it hit the 61.8% retracement and it's now bouncing from that level as you can see right there-
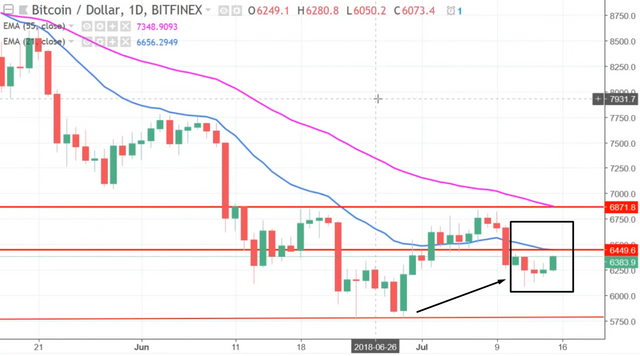
Now I should just say I'm collect those chart on a Sunday. Now the weekend activity is not usually reliable because a lot of this activity is driven usually by BOTS and algorithms so we do need to wait and see how markets play out from the Monday Friday session as that tends to be much more reliable. Now let's take a look at this chart a Bitcoin here-
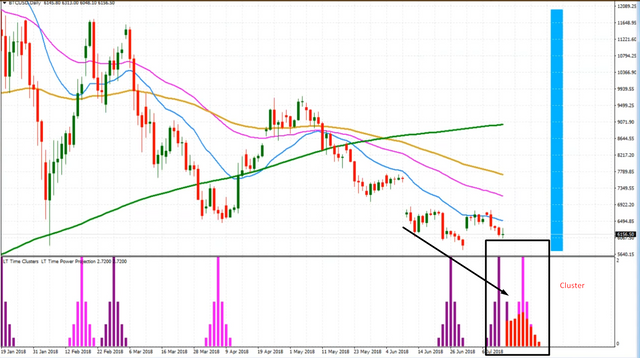
On this chart and you're probably wondering what is this massive cluster. The red cluster you see the above picture. Okay this is a specific indicator that I created some time ago now last year and it's called the LT time power projection indicator like a bit of a mouthful but let me explain to you what it is you see most traders and in fact most analysts look at only one thing which is the price axis so that's the price axis on the right-hand side. All right but most people actually ignore the axis at the bottom which is the time axis.
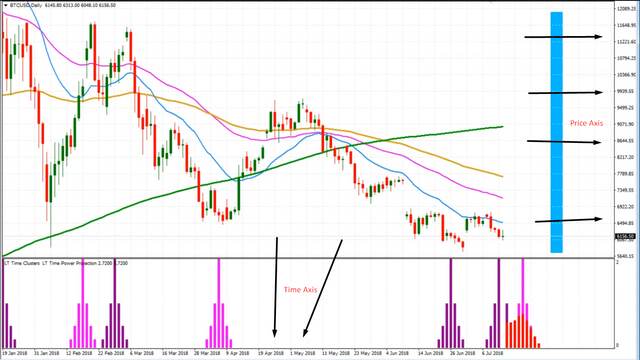
But time axis is equally as important and perhaps even more important than the price axis so we like to combine both price and time together. Now, why is that important because price only gives us resistance and support.
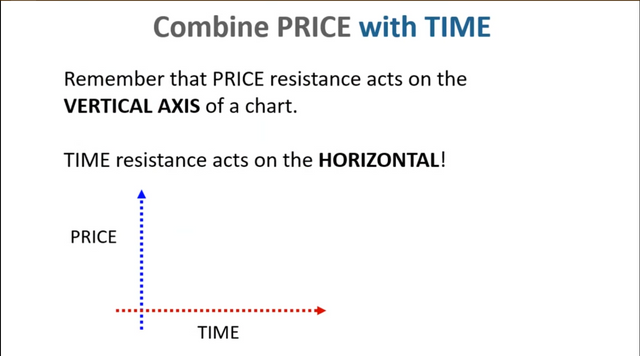
On the price axis, in other words, the floor, and the ceiling. On the charts, that time resistance acts like a wall okay it acts like a wall on the price.

I'm interested in I want to see how this time resistance act on price as well. All right guys so that's what we're going to talk about here and in case you're wondering the theory behind this actually was put forward by fantastic trader her name is Carolyn Boroden and she said that-
-Carolyn Boroden(Trader And Leading Expert On Time Analysis)
All right guys so what Carolyn's saying there is that we should not just be looking at the price axis but both time and price to increase our probability increase our odds and edge and just before I show you the examples let me just explain that time resistance is non-directional okay? So it doesn't actually show you which direction the market could go however you can use it to give you the sense of direction you could do that but essentially what time resistance is telling you is three things-
- When inflection points are about to occur.
- When big moves are likely to occur.
- When a market move is likely to pause or stall.
All right let me give you an example here for example-
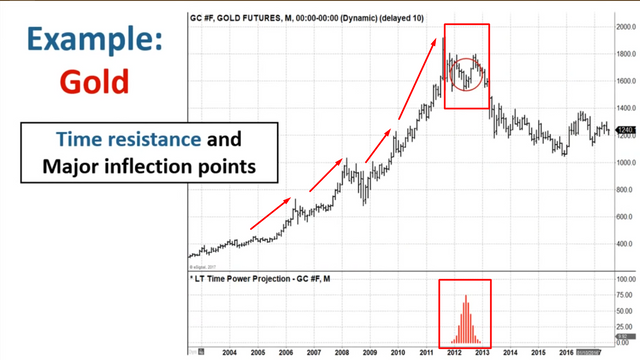
This is when gold when gold wasn't that massive bubble that we had some years ago notice as it went higher and higher we actually had an idea we had a leading indicator of when that bubble could potentially burst as you can see here from our from our massive spike here on the LT time power projection indicator as you can see that came indeed at the very top on the gold market before it reversed it actually reversed direction and crashed from that point.
And here's one here on Bitcoin. Now, this is a Bitcoin back in July last year notice that as Bitcoin was dropping here we knew in advance, in fact, this is a leading indicator. So we knew about this in advance of it happening we knew exactly which date or between what date ranges the price of Bitcoin could potentially reverse direction, as you can see right there. There, was our LT time power projection right there as you can see-
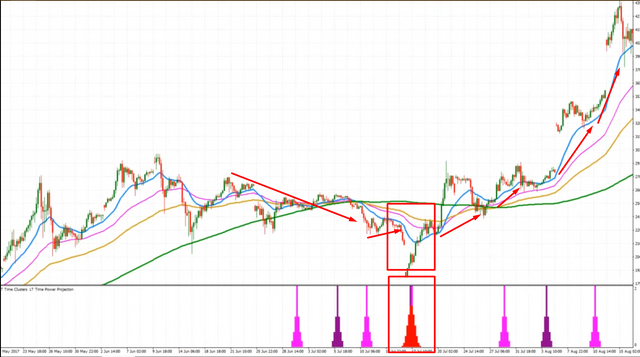
and then BOOM the price then reversed direction okay? Now remember just like everything else there's no guarantee or there's no certainty that price will reverse. When we see that time power projection but again it doesn't crease our probability when you combine it with the price.
Here's another one for you right over here in September of that same year last year we had another time power projection which came very close indeed to this very significant low that we had here on Bitcoin again sometimes the parameters of the date ranges can be off by about a week or so let me show you this is Bitcoin back take a look at this you'll see right down here cluster. 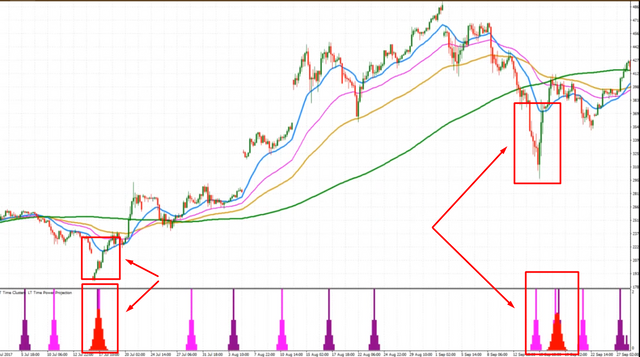
The clustering effect and by the way that is exactly what creates this red power projection when you see a clustering effect of time relationships coming together that is what produces the time power the red time power projection and notice that happened just a few weeks about a couple of weeks before this major top formed in Bitcoin.
And what do we see here we're seeing that right now we're having the same thing. Notice that right now we seem to be approaching another time power projection.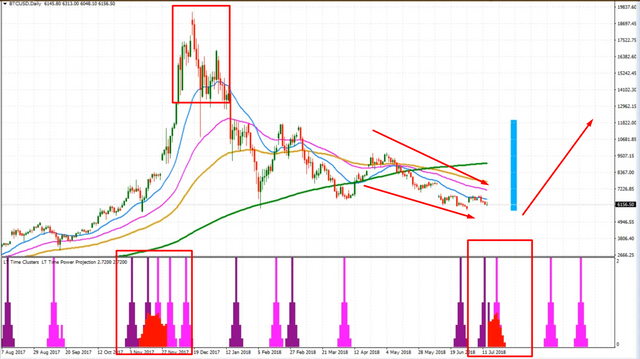
And I'll show you exactly what time range that is as you will see here so let me just explain one of the ways. I use this indicator which is, first of all, I look at the previous trend of the price the previous trend in the short term certainly has been to the downside. As you can see the downward trend right now we're having and you can see it's approaching this cluster. As the cluster of time relationships again what we're seeing here is this time power projection this red clustering effect here and that's giving us a time range between the 14th to 22st of July that gives us a peak. There's also a peak here the peak seems to be about the middle of next week or this week coming essentially so the peak is about the 17th to the 19th of July now you're probably wondering well.
What is this blue a rectangular formation of its vertical blue area? If I go in a lower timeframe a 4-hour chart we're seeing the right-hand side of the chart a deep clustering effect which produces a red power projection.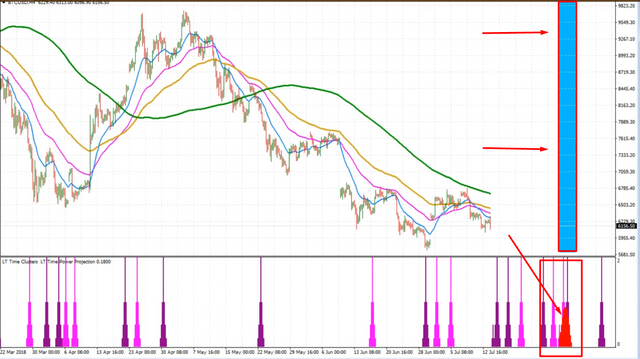
I'm interested! I'm more interested in the red power projections as opposed to the other ones. The other ones actually are there just to give me some guidance but it's when those clustering effects come together to form a red power projection. That is what's important that gives me a date range just to give you an idea of where that gives me a date range from the 25th to the 27th of July. So something potentially big could be happening in that date range between the 25th and 27th of July.
Now we don't know what exactly is gonna happen in those date ranges but I think we can
have a pretty good clue that either it's gonna be a major reversal or potentially a big move or both.
Now tell me, friends, what's your opinion? tell us in the comments and if you enjoyed don't forget to give an Upvote.
Thanks
Mintu Debnath
@mintu1319
This post has received a 1.74 % upvote from @drotto thanks to: @mintu1319.
You've received a lifting from @botox ! Consider delegating to earn passive income 20SP,50SP,100SP,200SP.
Tu viens de recevoir un lifting de @botox ! Envisager de déléguer pour gagner un revenu passif 20SP,50SP,100SP,200SP.
Nice information for crypto lover...keep it up
Thank you
I agree with the author, @mintu1319!
Thank for your comment
You have really shared a useful information.Keep up your good work.
Thank you brother