Bitcoin in-depth analysis - 13-9-2018 - How far can we go?
Today we're seeing a slight increase in the market. Especially the alts are having some gains. With Nano raising around 45%.
Week chart
Let's start with the Bitcoin analysis from the week chart.
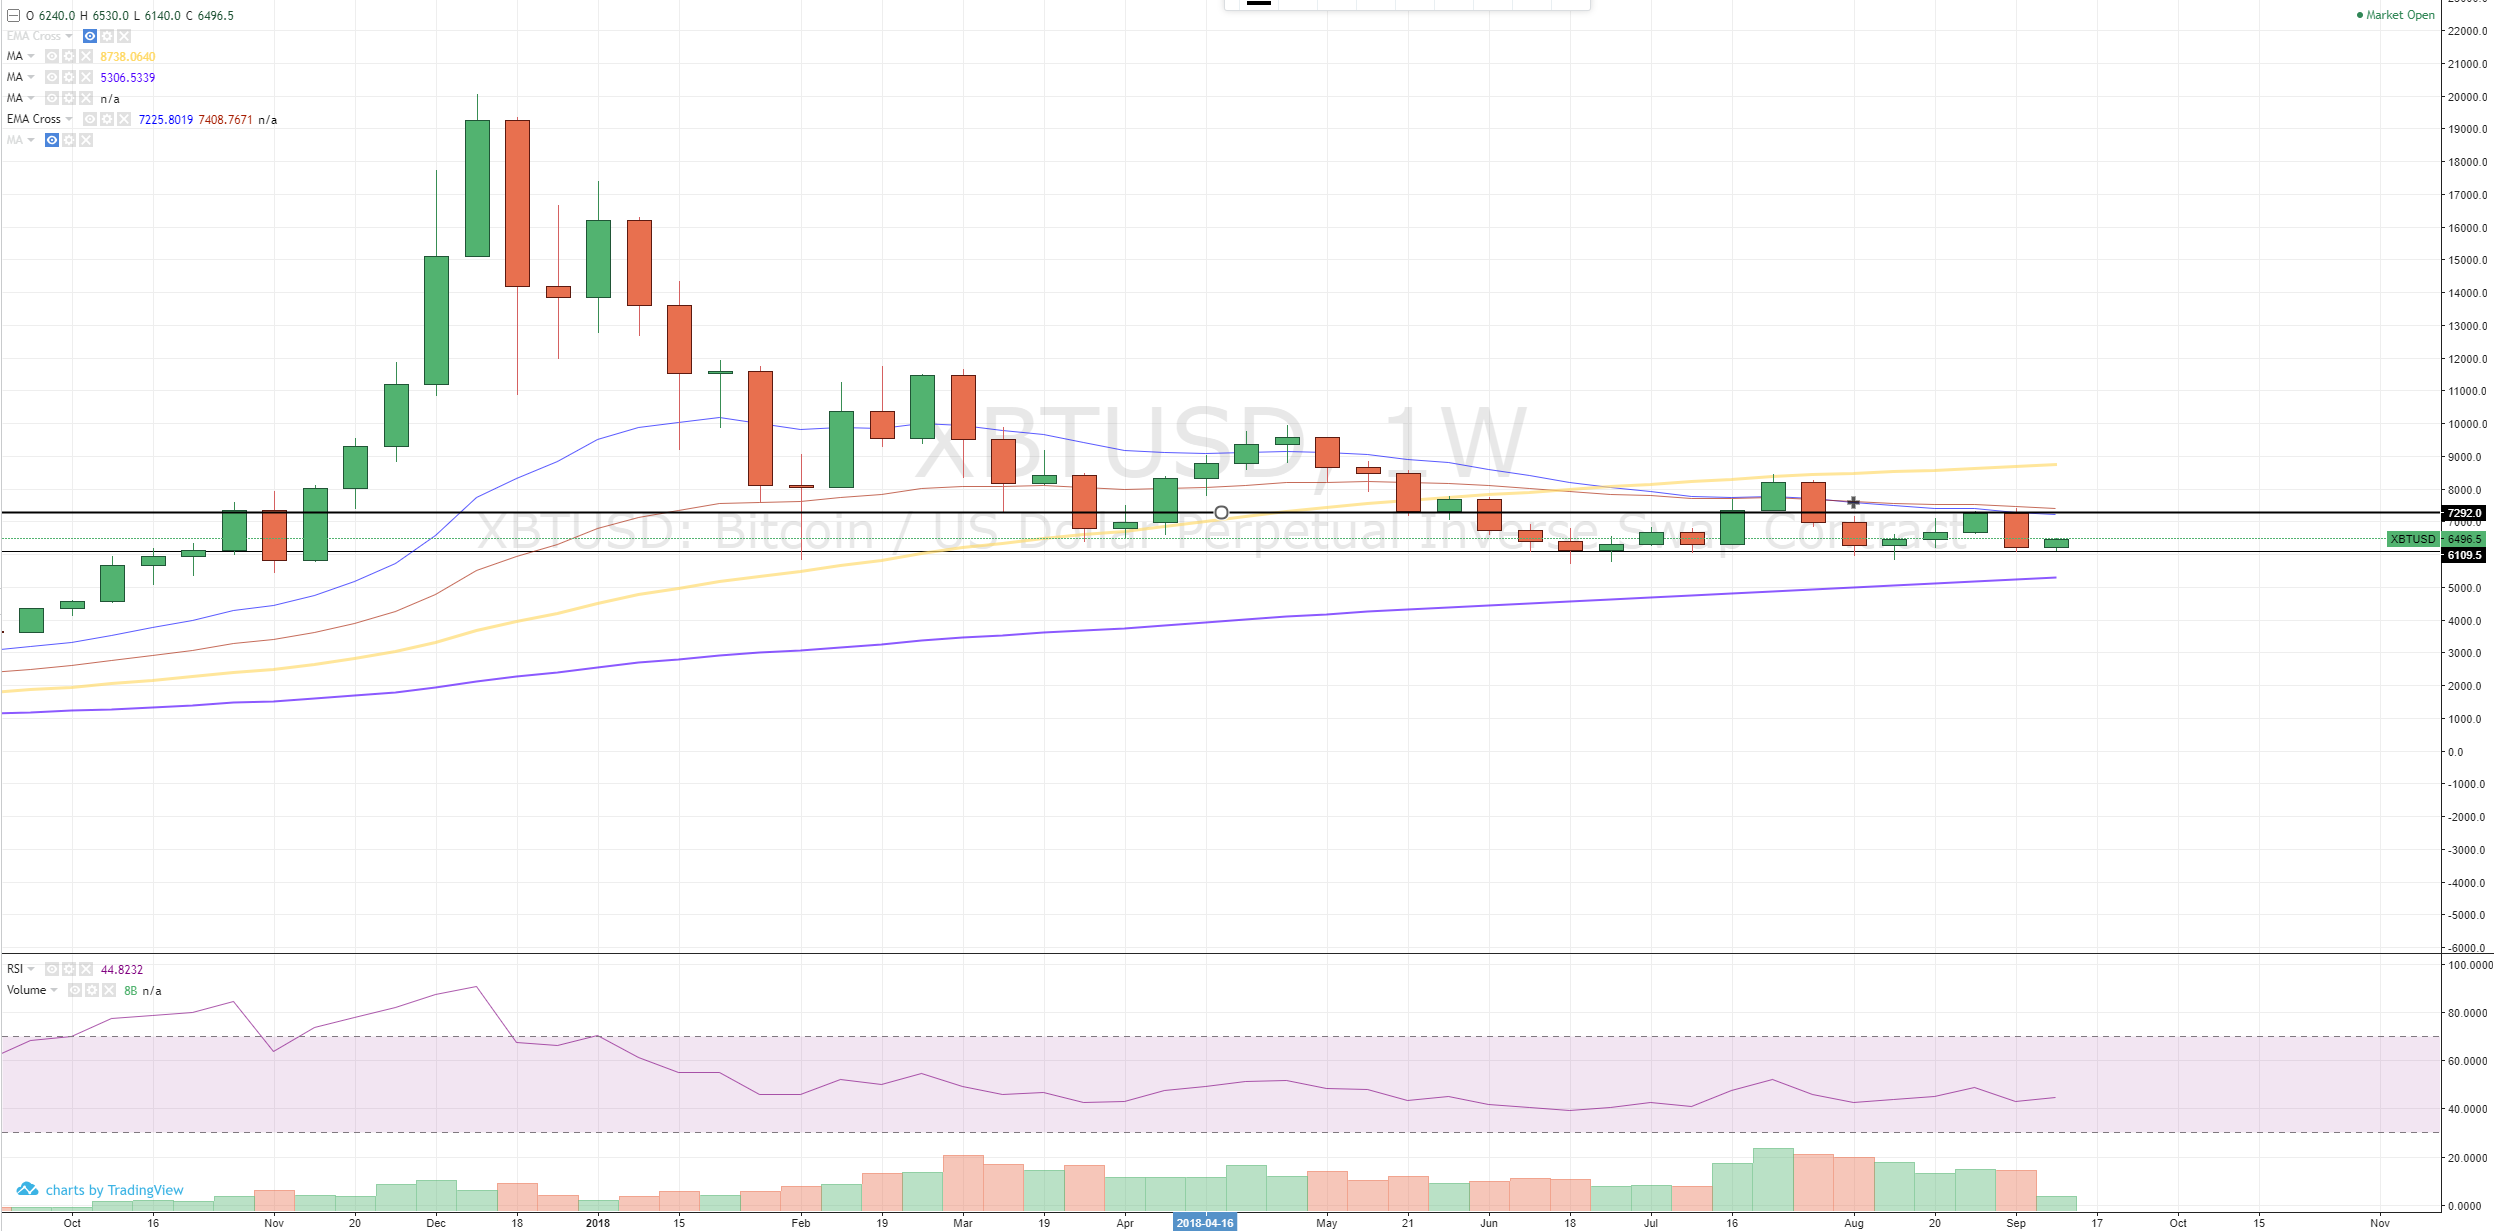
There isn't much to see only a some support at 6110 and old resistance around 7292.
There were two candles around the 7292 price level so maybe we'll be reaching this price point again. But it's likely not the case, due to the huge sell-off previous week.
Day chart
In contradiction, the day chart provides us a bit too much information.
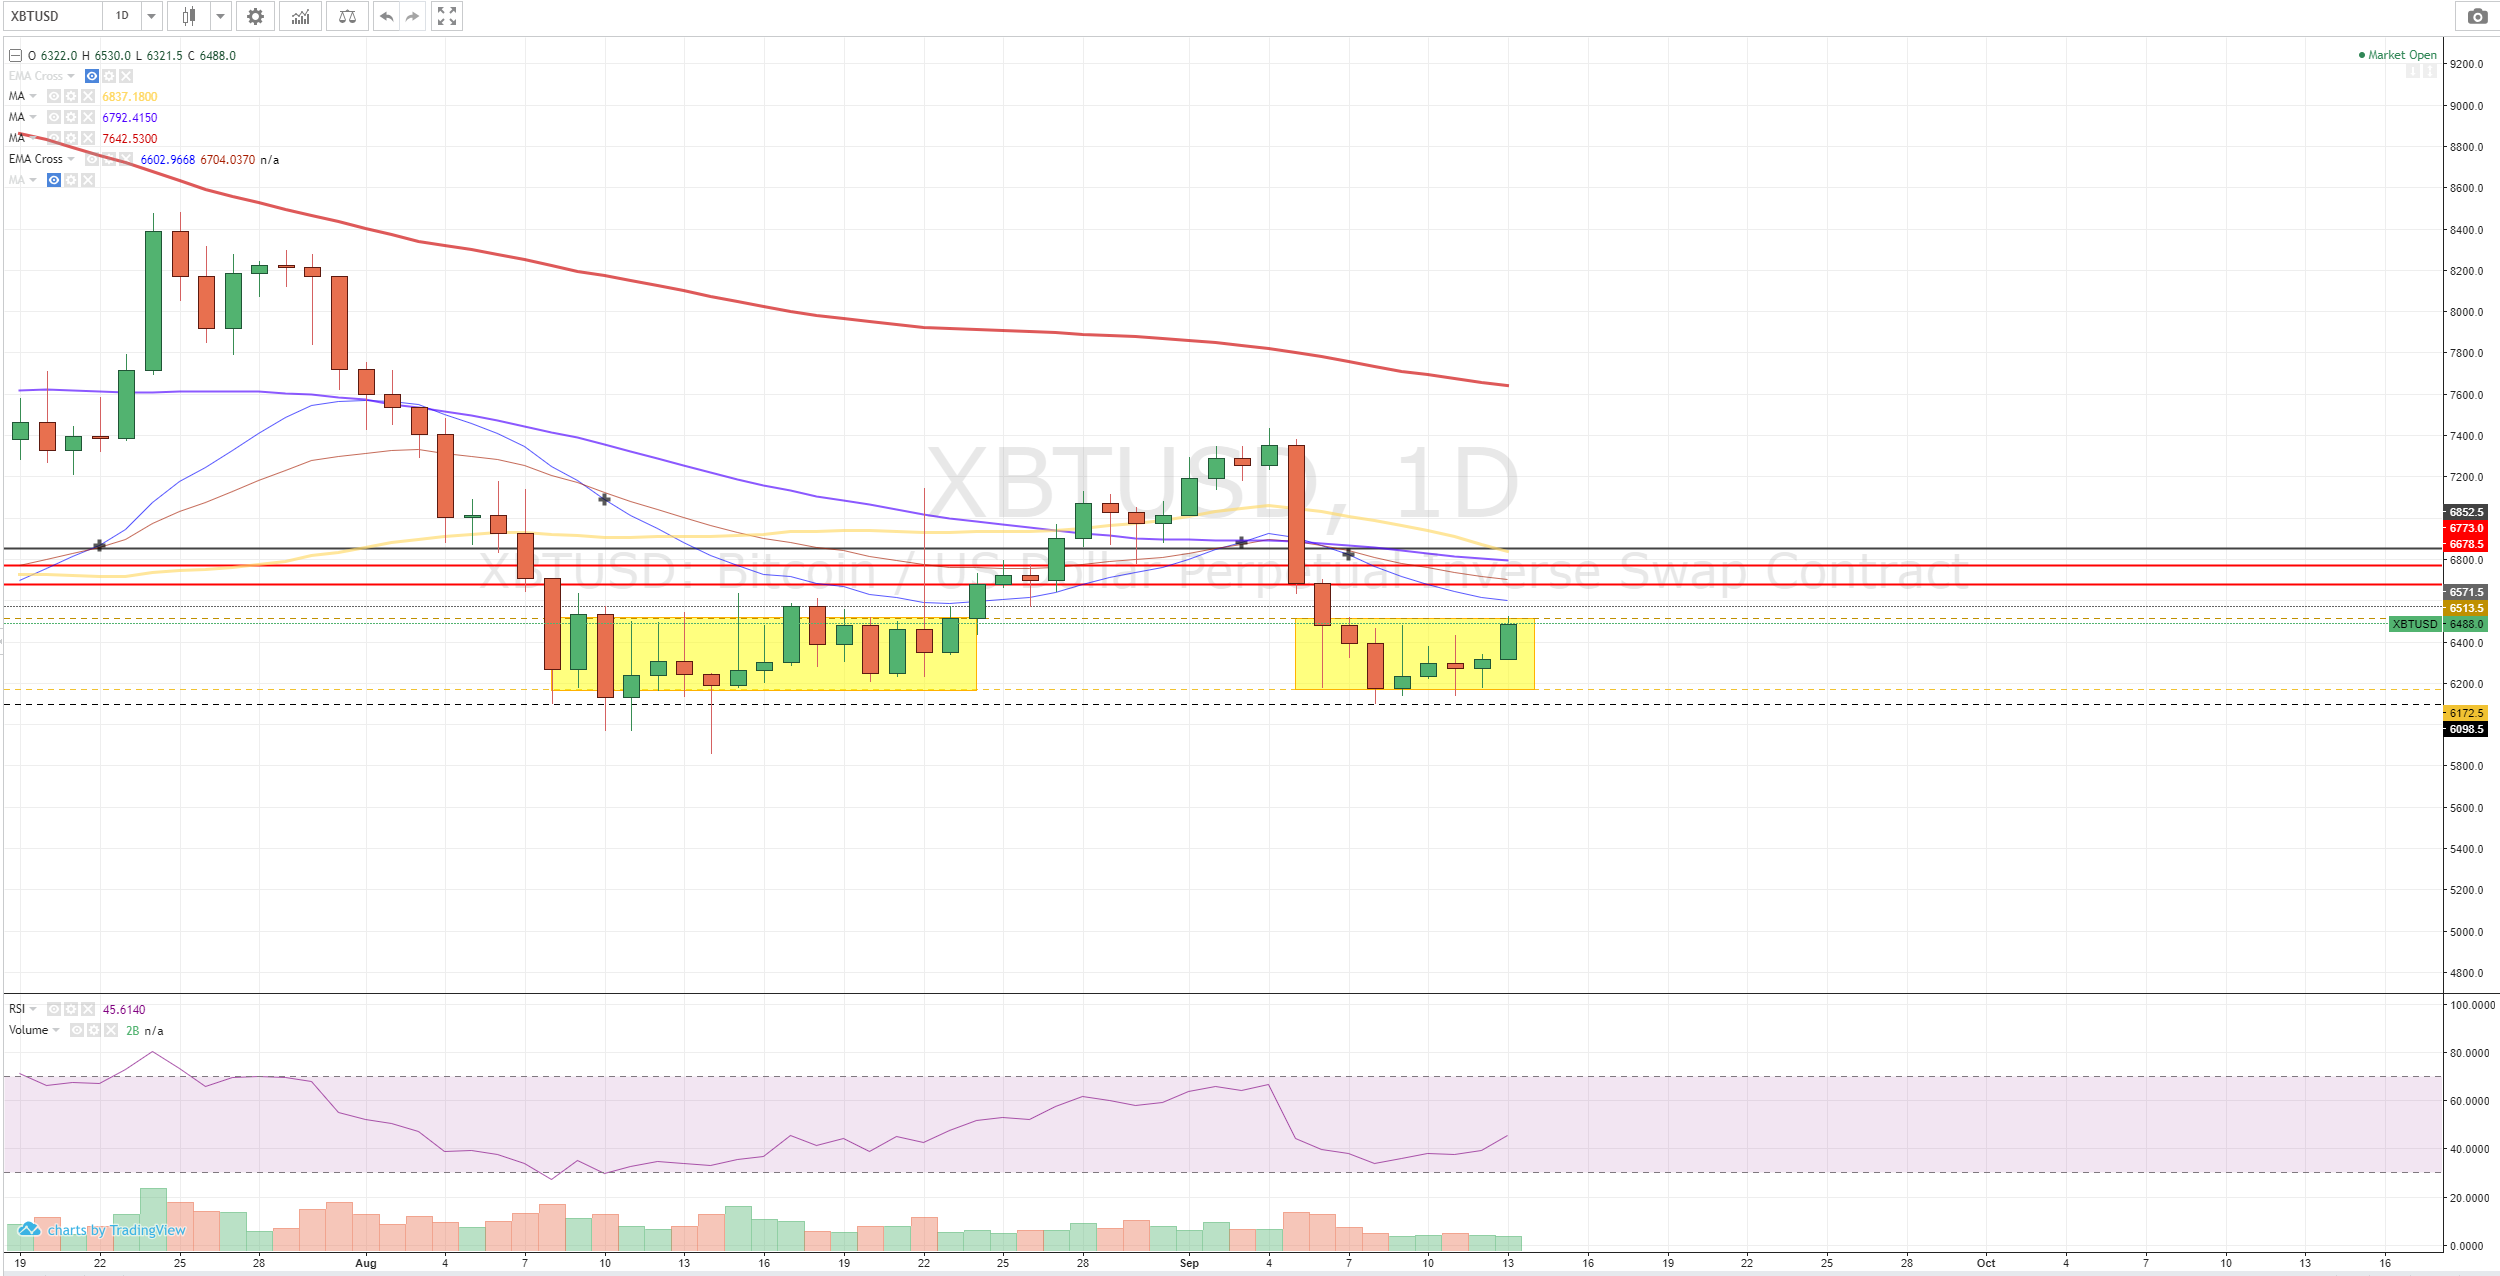
At this point we're inside a range between 6172 - 6513. (with a lowest point of 6098).
Today we're seeing some reversal around 6500.
I can't tell if we'll bounce back to 6200 again (inside this channel) or potential break through this 6500 level.
First resistance (today) around 6513, following by 6571, 6678, 6773 and 6852. It's hard to predict if we can reach this levels and it's strenght. The 6571 is an extention of this channel so it's doesn't mean we broke out after that reaching that level.
Also keep in mind, it's unlikely we'll get a better previous high around 7300-7400 level. So be prepared to fall down to at least 6000 if this trend reverses.
Also check the RSI which is >40 which is a slight bullish trend. So for short term we're fine.
4u chart
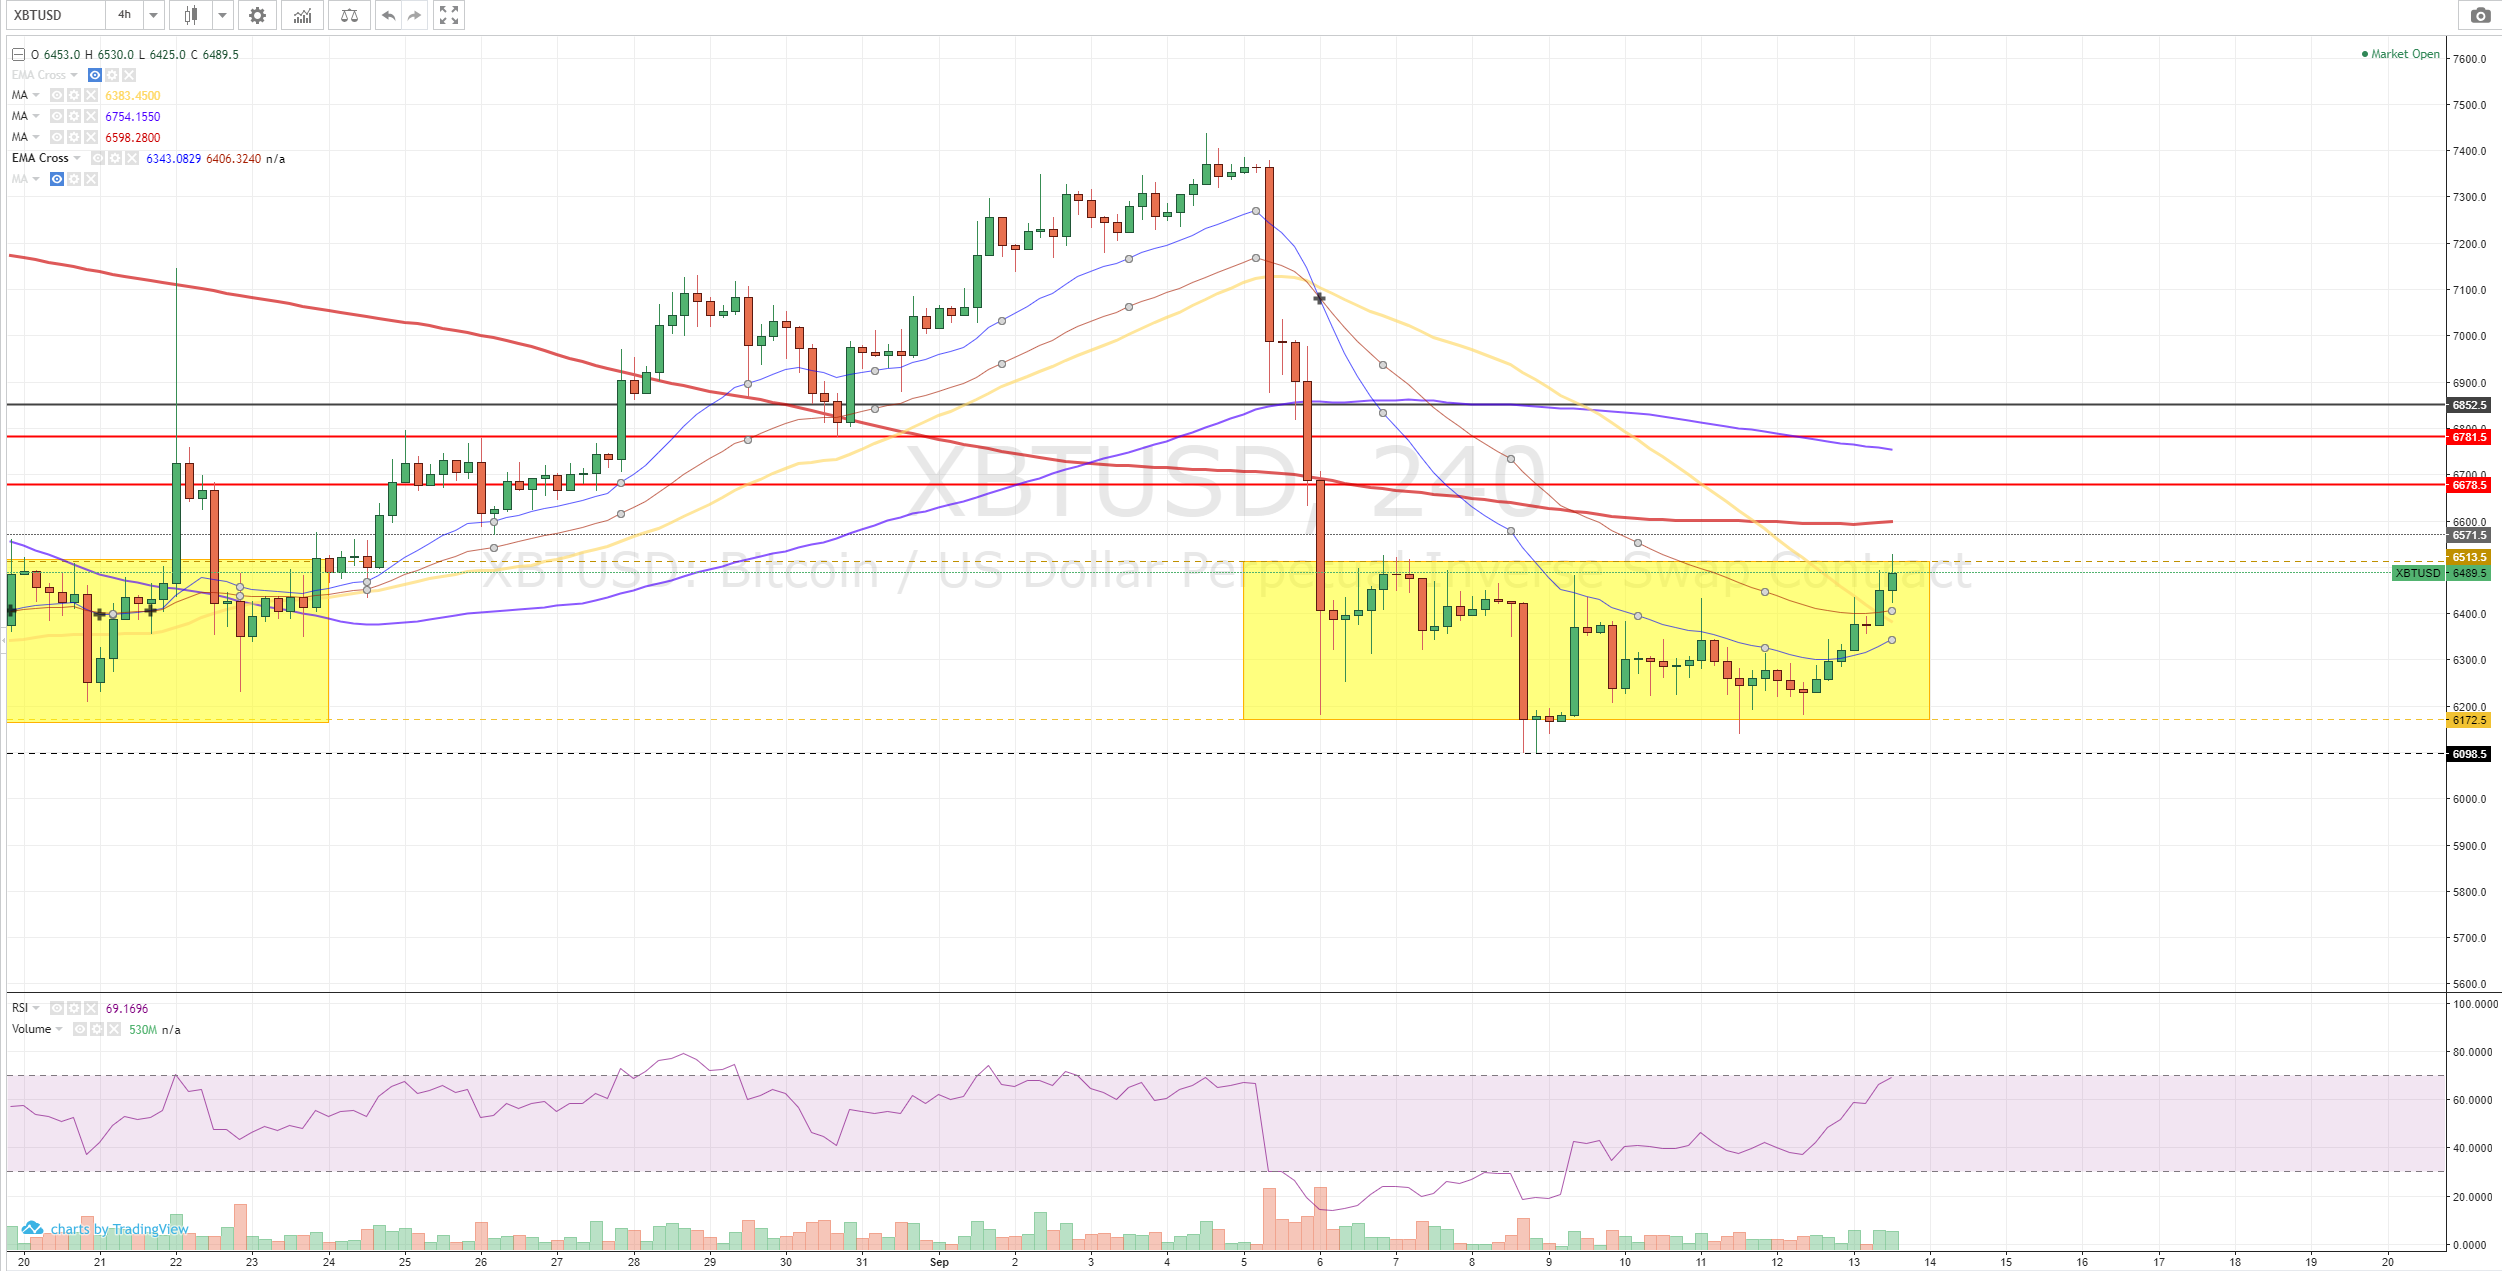
The 4u chart provides the same support/resistance as the day chart.
The ema(21/41) line (with the dots) are showing that we're two candles above. If the next 4u candle opens above this line, that will be a bullish sign for the time being.
Keep in mind, when the huge drop was occurring, why does somebody wants to do this, if they can't buy back for a cheaper price.
If we break through the 6571 resistance up to the 6678 (potentially) be carefull, because these markets are manipulated sometimes.
I can't imagine such huge drop was because someone wants to sell a lot of BTC at this price.
This makes it also more difficult to predict what's going to happen according to new resistance levels.
1H chart
The top we reached wat exactly around the previous top when we started this channel at 6528. That time was in setpember 6-7. After these tops the price went down to 6343 and 6324.
The ema cross shows a great sign here for a slight bullish trend. Which is a good indication for these kind of trends.
The RSI is a bit oversold here. It's likely to recover a bit in the next hours (by consolidation or going down).
15m chart
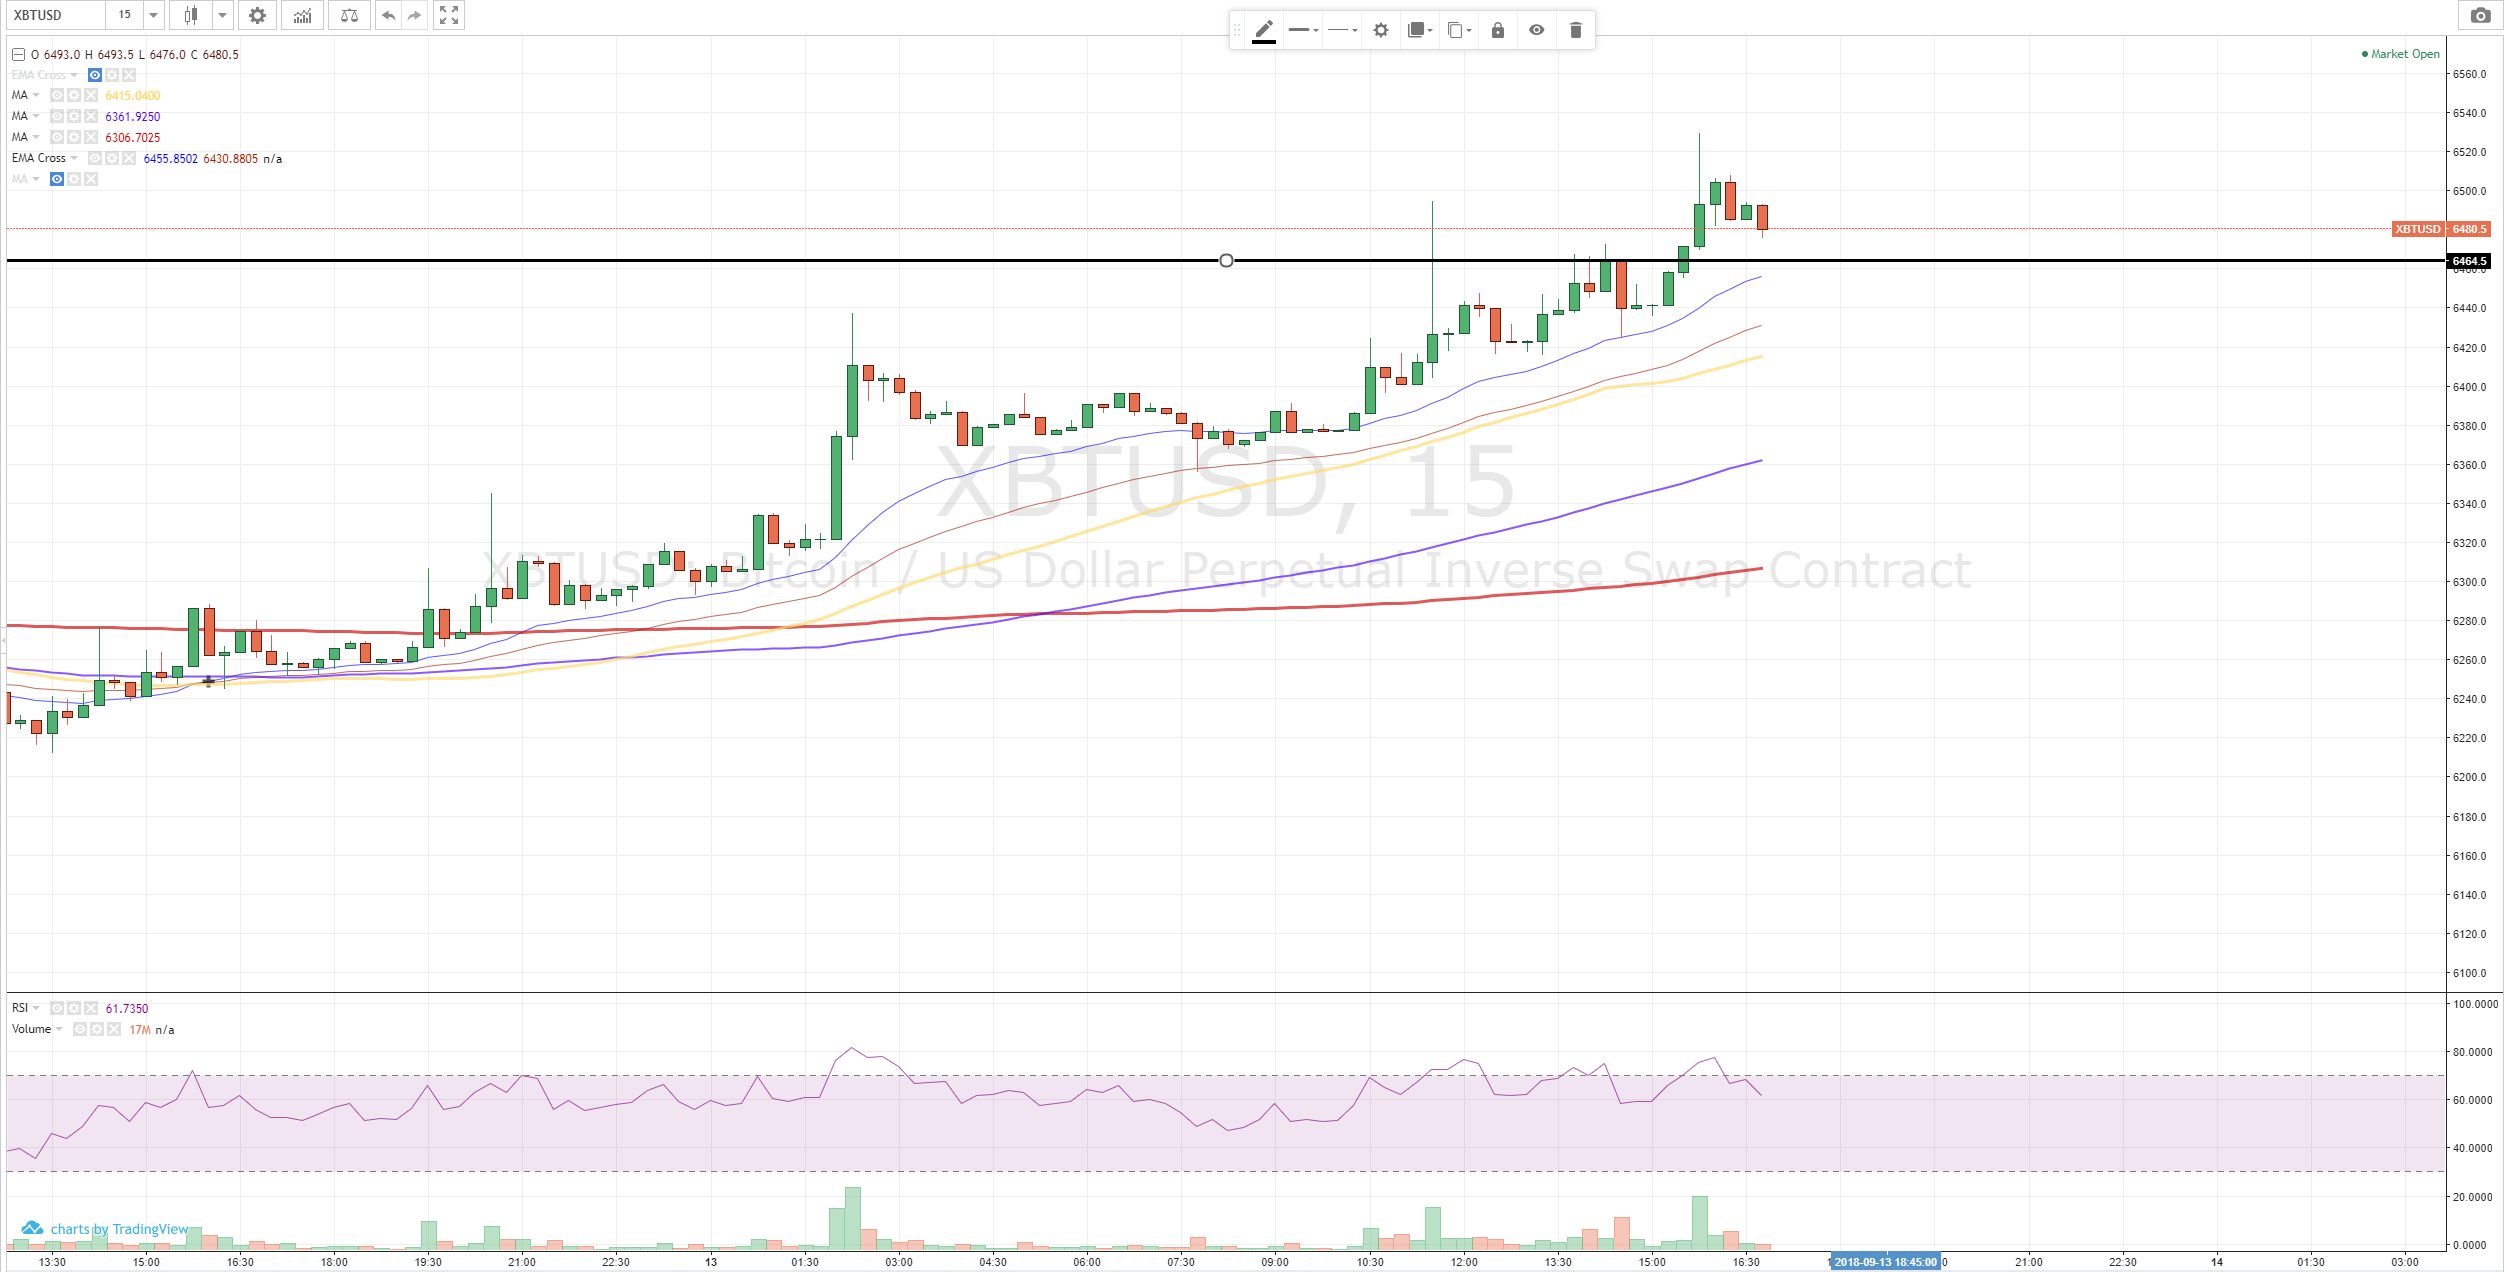
A lot can happen on the 15m chart. But we need to stay above 6464 to gain some bullish momentum (ABCD pattern).
UPDATE 15m
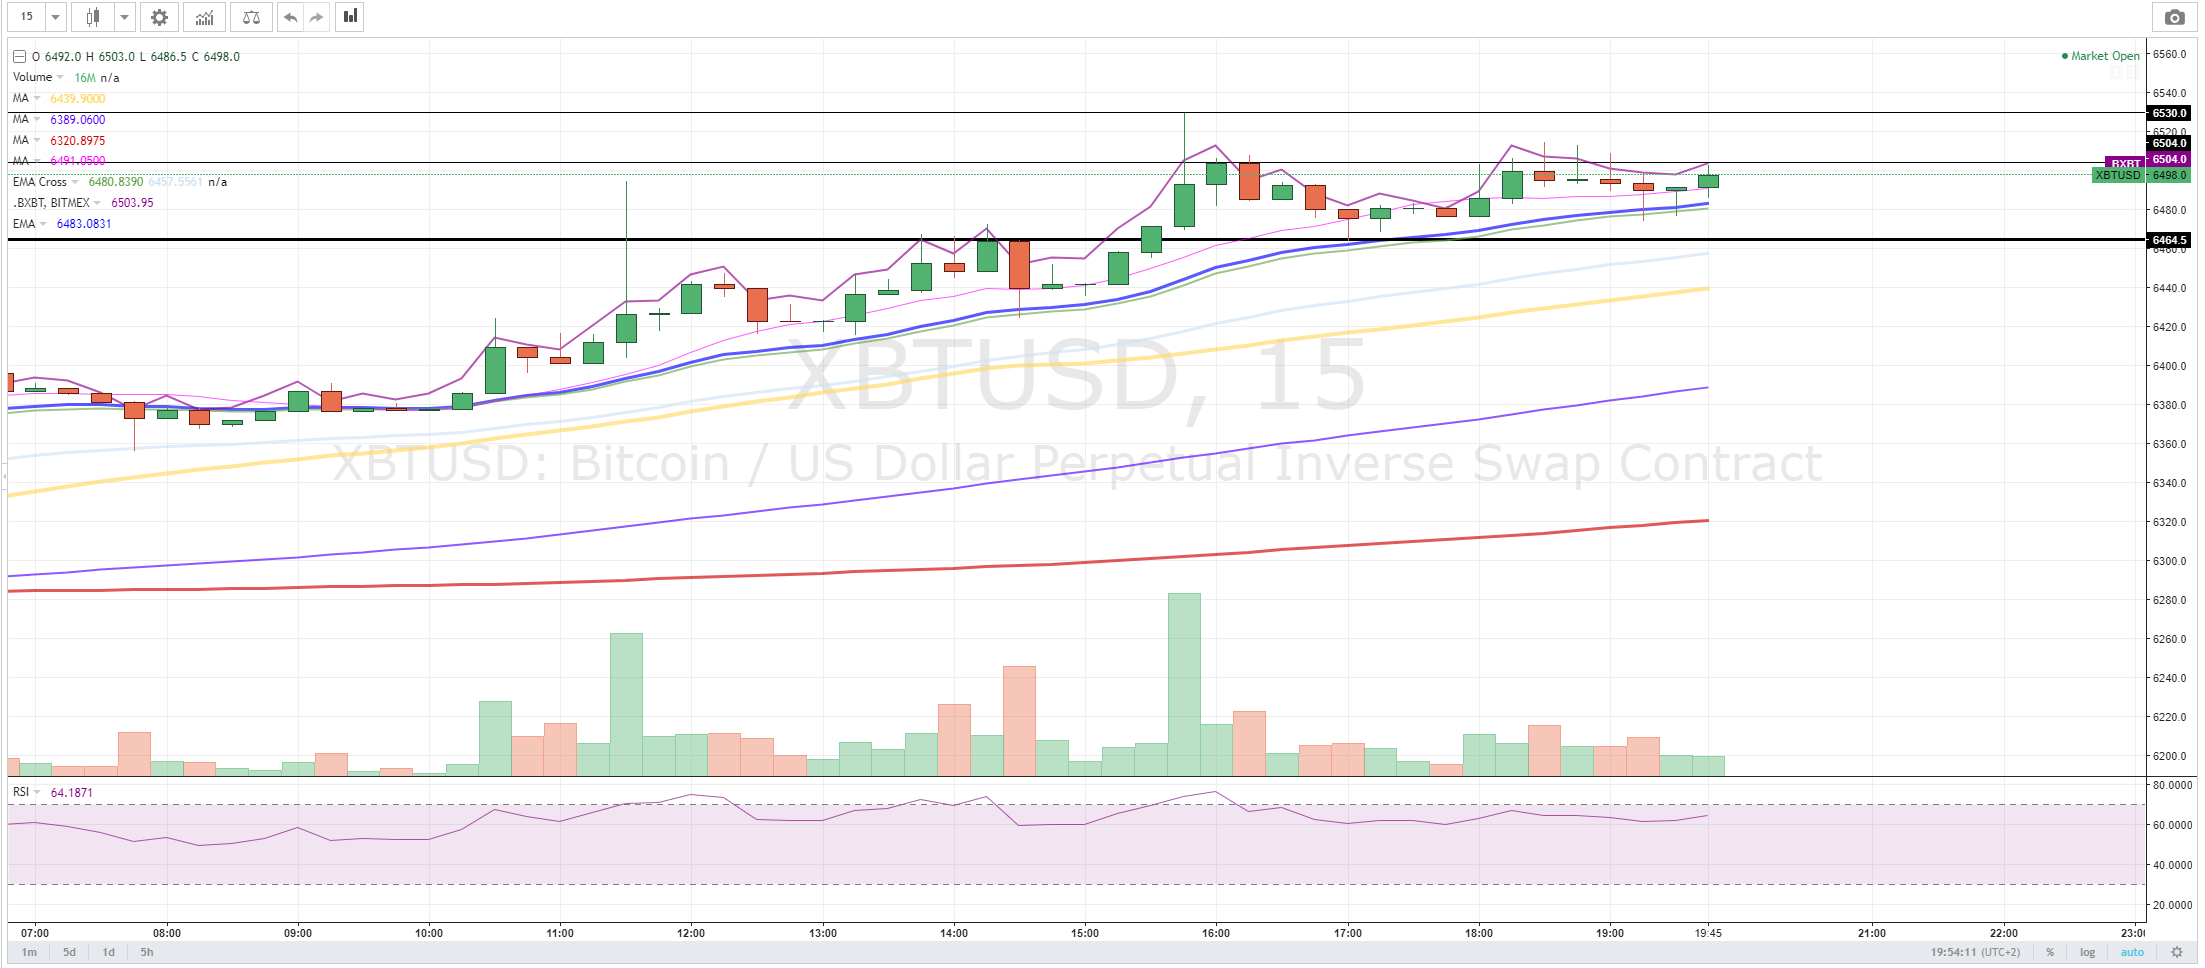
In the 15 I drawed some new lines. The 6464 was hit exactly as a support (which I mentioned before). Right now we'e insite the ranges between those lines. Looking for an up or down depening on which side we will break.
TA is no guarantee
You have a minor misspelling in the following sentence:
It should be occurring instead of occuring.Fixed.