Bitcoin Price Breakout Days Away, Long-Term Trend Bullish: Analyst

Bitcoin’s price has bottomed and will break out over the next few days. That’s what Robert Sluymer, head of technical strategy at Fundstrat Global Advisors, predicts.
As CCN previously reported, Sluymer said the technical setup is very attractive for a near-term rally. But he also projects a longer-term resurgence is in the making.
‘Markets Always Respond To Technical Analysis’
“I think the markets always respond to technical analysis,” Sluymer said. “Price is news in the crypto world. And there are some very important levels coming up for bitcoin literally in the next couple of days.”
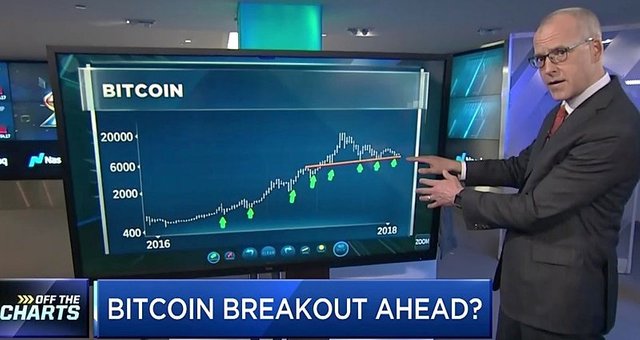
Sluymer said if we define a trend by a series of higher lows, the technical chart shows that there has indeed been a series of higher lows, both recently and dating back to 2016 (see below). That’s a bullish indicator.
Sluymer said the daily chart on bitcoin is also very instructive, as it shows that a bottom has been reached. “This 15-day moving average is a very good proxy for trends,” he said.
“If we think about what does it take to turn a security, a market, or a cryptocurrency around, it first needs to bottom. Then it needs to reverse through that uptrend or downtrend, and then it needs to turn that trend positive.”
Setup In Place For Near-Term Spike
Sluymer said the charts show that BTC prices have hit bottom, so the setup is ripe for a near-term escalation.
“We have step one in place. We have a bottoming phase in place, and it’s starting to go sideways,” he explained. “And it’s right at that point where it’s challenging its downtrend.”
Sluymer said BTC needs to break through two key low points at $7,350 and about $7,000. He said if bitcoin can’t bust through those levels, the longer-term trend turns negative, but that’s unlikely based on technical analysis.
“Once it breaks above $7,800, the trend is clearly pointing up,” Sluymer said. “So the setup is there.”
Another bullish indicator is that bitcoin is currently oversold, with a relative strength index (RSI) that recently topped 40. An RSI of 30 indicates an asset is oversold.
Sluymer said bitcoin’s RSI has stalled and is moving sideways, so it’s moving out of “oversold” territory.
Trading Volume Is Artificially Deflated
Another bullish signal that doesn’t show up on the technical charts is the flourishing over-the-counter market.
“There’s clearly a bigger OTC market developing. We hear it from the brokers and the clients,” Sluymer said. “It is happening. There are trades developing, but we don’t see it in the charts. What you see in the charts is the trading volume getting lighter and lighter and lighter as the cryptocurrency moves sideways.”
Sluymer said huge block trades are occurring but aren’t showing up anywhere, giving a falsely dismal impression of bitcoin trading volume.
Meanwhile, Sluymer’s colleague and boss, Fundstrat co-founder Tom Lee, “absolutely” stands by his bitcoin price target of $25,000 by the end of the year.
thanks!
welcome