Bitcoin Report 10.06.2018 - Bitcoin Crash to 3K on 9/11 2019?
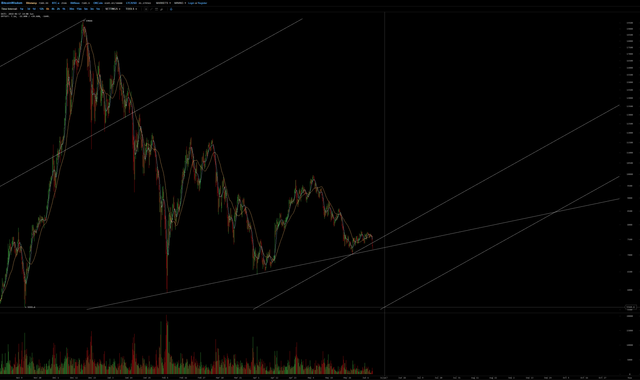
Bitcoin just fell through an ascending support line. I did not expect this to happen so soon. It bounced back on the less steeper support line that starts on 6 February Low and very tightly connects the Lows of April and May.
Where do we go from here?
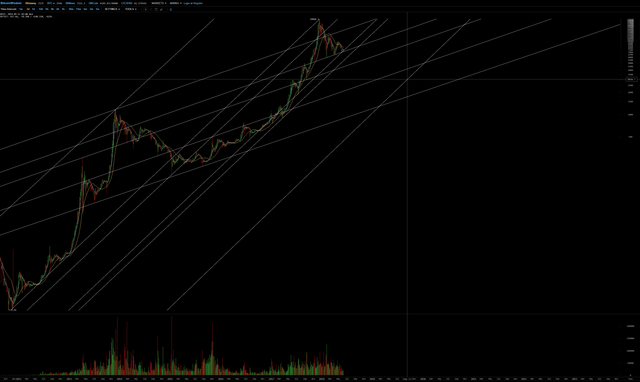
I decided to search for other trendlines that are parallel to this less steep support line.
I see a number of scenario's that could play out and found some surprising connections.
Let's have a look at them.
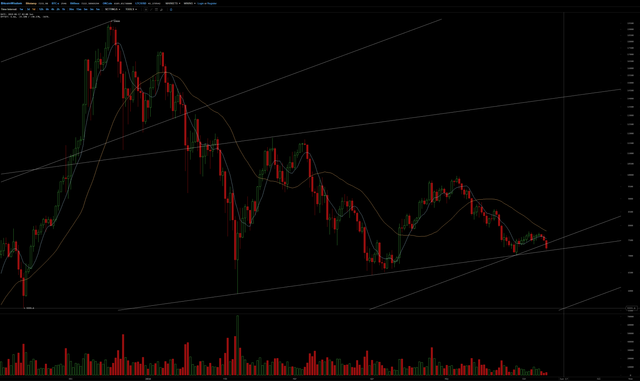
Scenario 1. Bitcoin Drops to 1300 USD in Late February 2019

The 2 lowest baselines of the 2 series cross each other at the height of the March 2017 ATH
Scenario 2. Bitcoin Drops to 3K on 9/11 2019
A bit of a scary and sinister scenario. The lowest of the 'Primary' set of trendlines crosses the very sharp 3K Support/Resistance Level of 12 June and 15 September 2017
Scenario 3. Bitcoin Drops to 5K in Mid January 2019

The first 'Primary' and second 'Secondary' trendlines cross each other at the 5K Level of the 2 September 2017 ATH
Scenario 4. Bitcoin Drops to 5555,55 USD on 17 June 2018
The second 'Primary' trendline crosses the 5555,55 Low of 12 November 2017 a few days from now!
A Historical Perspective
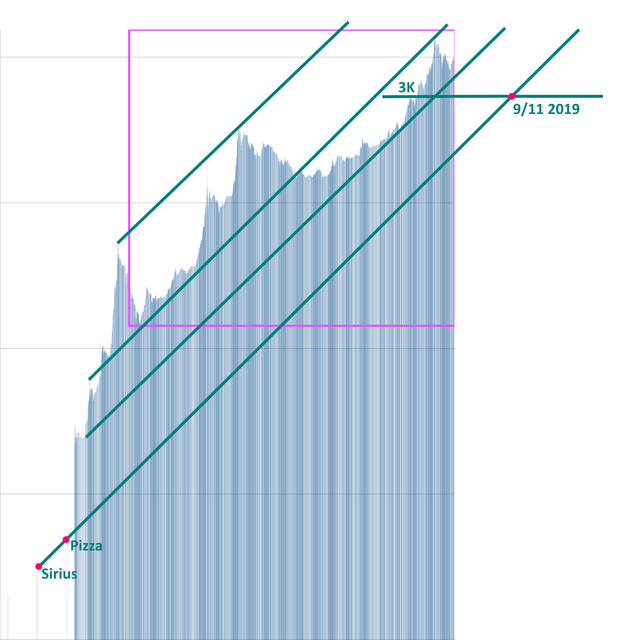
This Logarithmic Chart shows the 'Primary' set of trendlines, that goes back all the way to the 2 first transactions of Bitcoin. The Purple Square is the part of Bitcoin History that can be viewed on the Bitcoinwisdom Charts.
Great post. I think your market analysis is too good. Thanks @pagandance
This was the dip i was expecting may be its just the calm before the storm if you know what i mean :D
I wonder why the Alts are going down too? Where is the 'money' going when almost nothing else goes up but goes dow in stead?
Maybe I'll buy me another bitcoin when we get a round bottom at the 5555 Level :-)
I dont know about any other level but 3300-3600 will be kissed at least once before December 2018. What goes up ...comes down. When the price is driven by speculation, it does not hold.