BITCOIN – Weekly Wrap-up and Long-Term Overview: March 11, 2018

…Opening Comments
For those who are following along, as I mentioned earlier this week, a recent twist of fate has led me to close down shop on my short-term legacy market service, which I’ve been doing daily since 2003!
However, I continue to provide a long-term market service, which now includes coverage of BITCOIN! As such, I am repurposing my time and skill set to report more frequently on the price action occurring in BITCOIN.
I will use the increased frequency to focus more upon the short-term, while reserving these “Weekly Wrap-Ups” for quick reviews of what transpired earlier in the week, along with a focus on what the long-term outlook is currently looking like for BITCOIN.
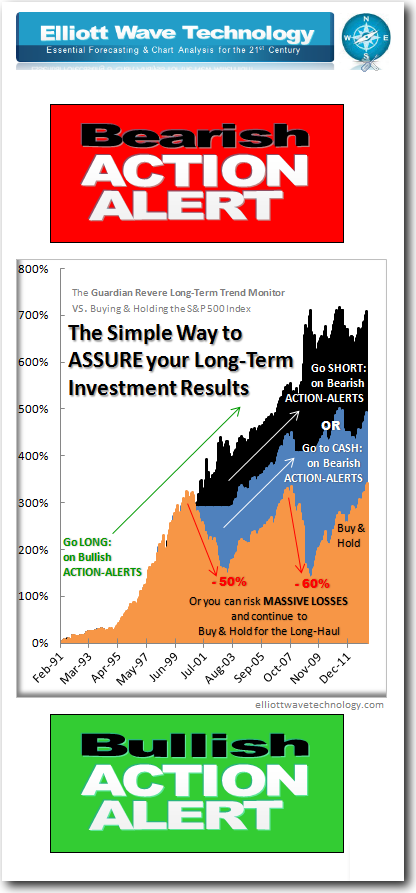
The focus of my long-term trend following service is to provide examples of what automated strategies are doing, which simply illustrates and shares when these given strategies have determined that long-term trends have changed from bullish to bearish. What folks do with that information is entirely up to them, along with their due diligence, and consultation with their registered investment advisors.
Until recently, this trend-following service focused on just three legacy markets, the S&P 500, Gold, and Silver. I have just added BITCOIN to round out and diversify the entire portfolio.
For those who might not be interested in reading the entire article or for those anxious to see this weekend’s video and charts, one can scroll to the bottom of this post to find them. One can always come back and read the rest later if they wish.


…Additional Comments
I’ve always believed in diversification and playing all sides of the fence in hedging one's bets – even if it means participating in legacy markets, or markets like Gold & Silver, which are often suppressed by the powers that be. I have multiple decades of historical data from which to test my long-term trading strategies for these three legacy markets, and the results have been outstanding over the decades.
Adding BITCOIN to this mix, though a welcome adjunct to the very concept behind this simple service, is a bit of an experiment in that there is not much in the way of historical data available to test and quantify the efficacy of instituting an automated long-term trading strategy over the "Long-Haul".
Be that as it may, I am of the opinion that adding BITCOIN to the mix will provide yet another layer of diversification and insurance against a potentially failing financial system. The strategy currently in place for capturing long-term trends in BITCOIN seems to be performing well on balance; however, the strategy will likely need some adjustments as time goes on. Whether or not I shall include BTC - email - Action-Alerts shall be contingent upon the demand from those STEEMIAN'S who request it via their collective participation and commitment to "The Monitor".
…Last 5 Long-Term BTC Trades
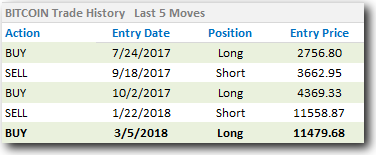
Given that historical BTC data from Bitstamp goes only as far back as August of 2011, 7-years of data are not that reliable, but we have to start somewhere. Mind you, the above illustrates only the last 5 trend changes and does not represent the entire 7-year data series. It will take a lot of work to compile a spreadsheet performance history for the entire run – perhaps one day...
Despite the fact that the latest example of a long position suggested on Monday 3-5-18 will no doubt whipsaw into a reversing short position this Monday, with a loss of 20% or more, the 196% percent gain on the long position suggested on 10-2-17 more than makes up for it. That’s how trend-following systems work over the long-haul. One’s winning trades far outstrip the losing trades by a substantial margin.
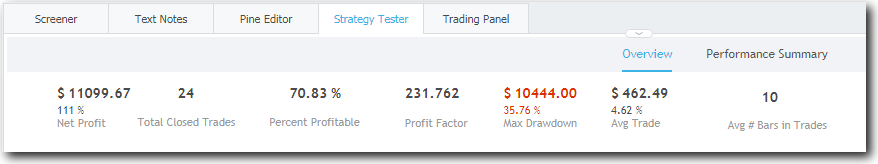
The particular strategy that I’m using via the Trading-View platform does not account for taking “short positions,” and simply gets flat or goes to cash when there is a “sell signal.” Be that as it may, of all the 24 “long-only” trades taken, nearly 71% of them were profitable. I’d have to do my own calculations if I wished to see how “short-trades” would have changed the stats.
It is important to note that “trend-following” strategies NEVER pick bottoms and tops; instead, they identify and partake in long-term trends. This means that such a strategy will NOT get you out at the top and it will NOT get you in at the bottom; it will, however, alert you when the long-term trends have turned from bullish to bearish and then in contrast, when they turn from bearish back to bullish again.
…Short-Term and Long-Term Analitical Bias
I include the tables below with each of my market-related updates. I’ve done so because a friend of mine, @famunger, an ardent follower of technical analysts here on Steemit, uses a similar format in his daily recap of what the collective analyst-community within STEEMIT is currently thinking. He has recently mentioned that he was preparing to add me to his list of analysts that he follows. Needless to say, I was delighted at the prospect, and tried to gear my updates to make it easier for him to see exactly where I stand.
The two tables below are very straightforward. The first is a “short-term” table listing my current short-term bias, my next downside price target amid that bias, the pivot low thus far in place from which I am working under, the nearest level of support, along with two levels of resistance.
The second table is "long-term" in nature - once again spelling out my “bias” or “sentiment” posture over the longer-term, and what my current price targets are for the current year within such a perspective.
Please note that the levels in the “short-term” table below do not correspond with those discussed in the video because in the time it has taken to finish and upload the video, the market rallied sharply to a level of 9,750.
| Short-Term | Bias | Target | Low | Sup | Res-1 | Res-2 |
|---|---|---|---|---|---|---|
| @passion-ground | Bearish | 7,463 | 5,920 | 9,375 | 9,750 | 10,027 |
| Long -Term | Sentiment | Target 2018 |
|---|---|---|
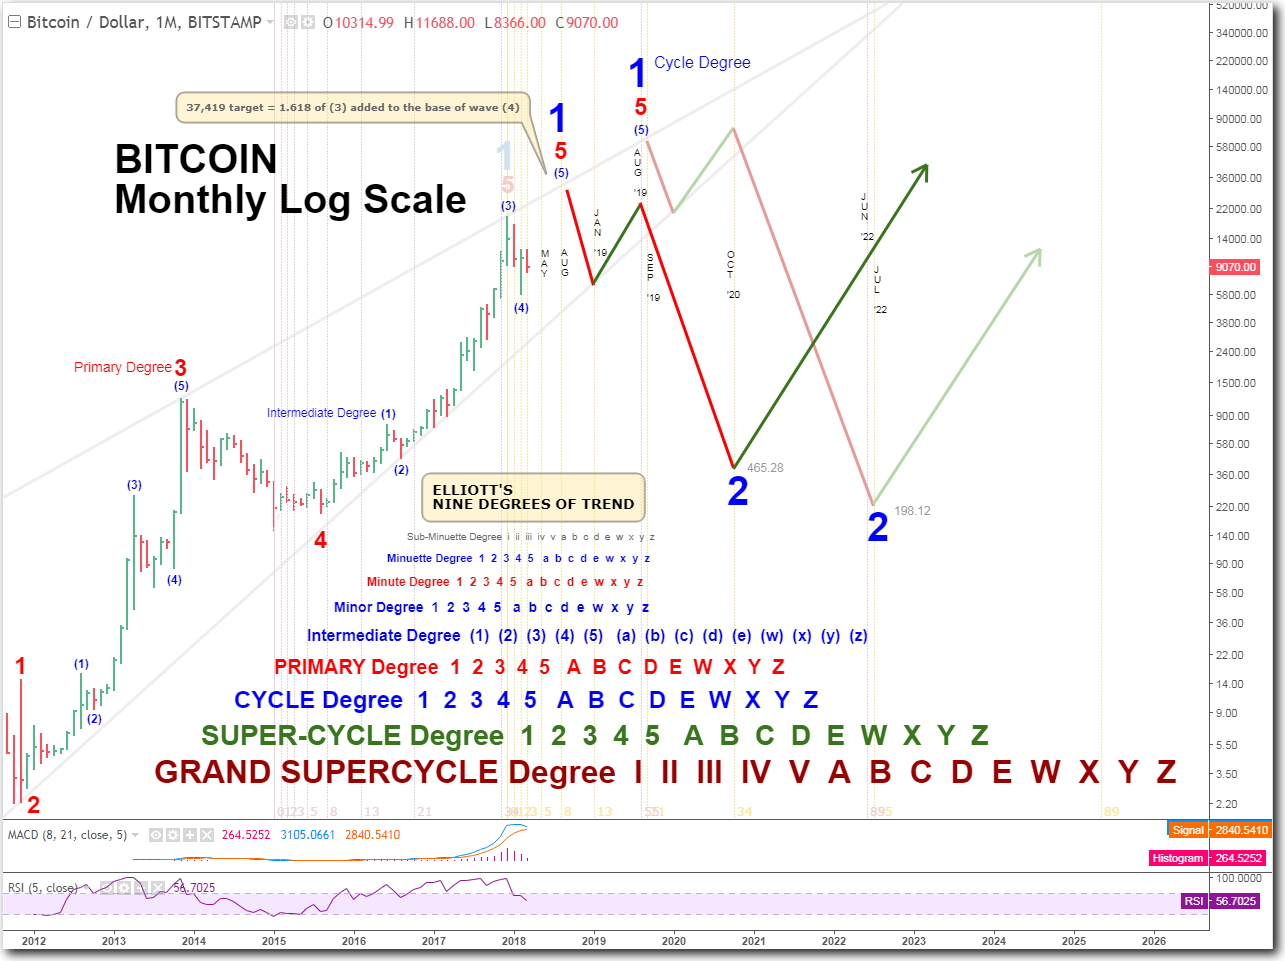
| @passion-ground | Moderately Bullish | 12,235 min / 37,419 max |
To provide some appropriate musical context to my take on “pro-active” long-term investing strategies vs. the more popular and quite sheepishly passive “HODL” or “buy and hold” no matter what happens, I proudly share with you a week #75 entry to the Open-Mic contest by one rather talented musician who goes by the name of @jumpmaster. I don’t know if his handle is referring to the “jump you motherfu%*er’s” meme that was tossed about during the financial collapse of 2008, but if it is, more power to him! Just save the jumpin’ for the legacy Wall Street “Whales,” okay, my brother! :-) Stay on the ledge, bro – stay on the ledge!
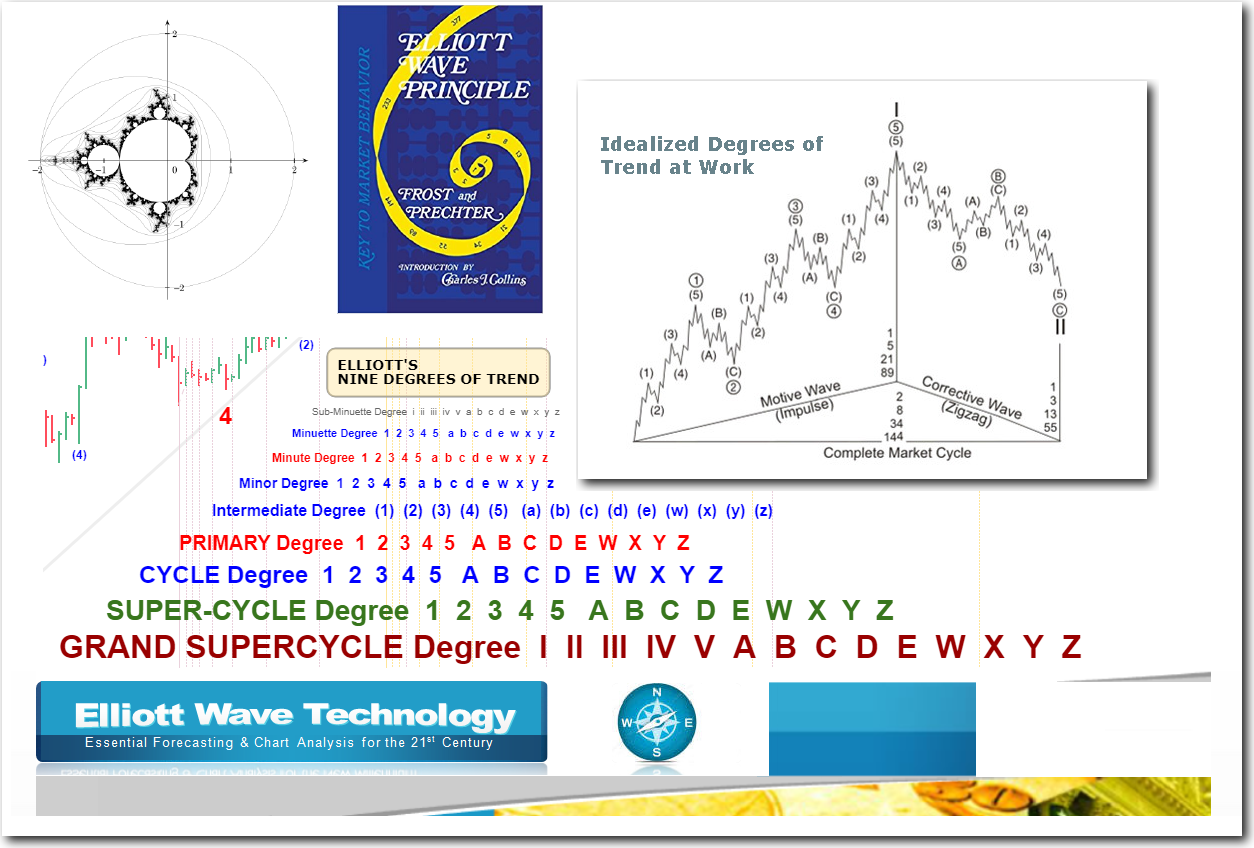
…A Visual Review of Elliott’s NINE DEGREE’S of TREND
Right Click and open in new tab to view full size image.
…For the Week Ending 3-11-18
…Key Statement:
In the time it took to finish and upload the weekly video, the market has rallied in 5-waves of impulsive advance off the 8450 low. This rally stalled at 9750, right near the prospective upper trend channel illustrated, and it may possibly mark all of the "minuette" b-wave I speak about. We'll just have to wait to see what happens next.
Right Click and open in new tab to view full size image.
…Video Update
Select HD and “Full-Screen” for the utmost clarity in viewing this video update.
Those who may be interested in the "Long Term Trend Monitor" may visit the homepage here: http://sp500-long-haul-trend-monitor.blogspot.com/.
Should anyone have any questions whatsoever, please provide them in the comments and I will do the best I can to respond respectfully, expediently, and accordingly.
Although I am most certainly “NOT a Whale” in this virtual realm of STEEMIT, I suspect that many might consider me such, (or at least a “Dolphin” anyway) - relative to the legacy realm of our current reality - as it has been so brutally defined and imposed upon us over the last hundred years. Thank you very much, "Central Banks," which are clearly key structural planks to a "communist manifesto." Damn them all! May the blockchain and Steemit NEVER follow suit!
I trust that the preceding analysis was generally objective, explicitly actionable and informative, and of relative and meaningful value for all those who perceive such analysis as a backstop to their individual ends.
Until next time,
Peace, Love, and Justice for All
DISCLAIMER: This post and all of the analysis contained herein serves general information purposes only. I am not a registered financial adviser. The material in this post does not constitute any trading or investment advice whatsoever. The trend-following strategies explained herein are for example only, and should not be construed as trading or investment advice in any way. The same thing goes for anyone subscribing to the Long-Term Trend Monitor. The subscription simply shares with subscribers what several automated trend-following systems are doing, and that’s all. The bullish and bearish alerts provided therein are for information purposes only, and they are not to be construed as advice to buy or sell. At the time of this writing, the author does not hold any positions in BITCOIN or any other crypto-currency. Please conduct your own due diligence, and seek counsel from an accredited financial advisor before making any trading or investment decisions. Should you decide to mirror or copy any investment or trading examples from this or any other related source, the decision to do so is entirely your own - as are the inherent risks involved in doing so. I am not responsible for any of your losses. By reading this post, you acknowledge and accept to never hold me accountable for any financial losses. Thank you.
For future viewers: price of bitcoin at the moment of posting is 9612.50USD
Cool convenience update for future viewers! Is that a "bot" that does that - or did you do that manually? Either way, thanks for posting a current price update!
Beep, boop - just a bot, don't mind me. Got confused so I have posted twice - somebody has some bug fixing to do :P