Bitcoin BTC 5 minutes Update - 30 Minute RSI. Are we Bearishly Diverging?


General Tone:
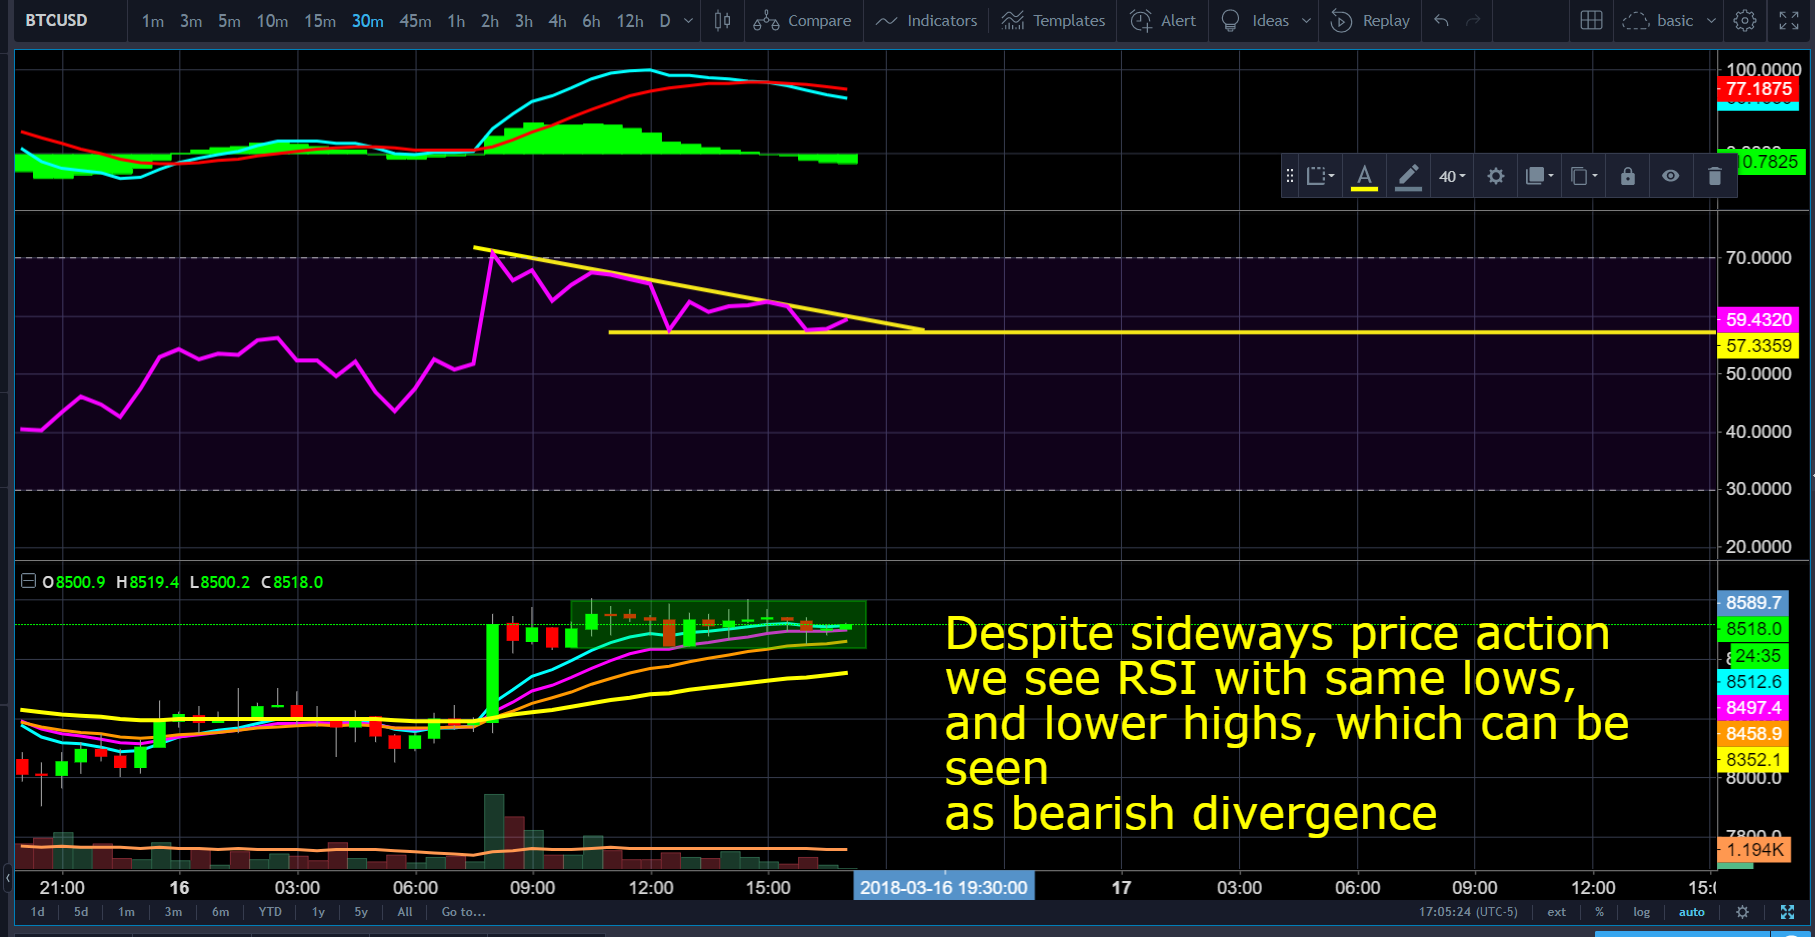
30 minute Chart. Are we descending?
We see the break above the $8,400 resistance, now struggling to break $8,600.
A Break above $8,900 will invalidate my bearish elliot wave count.
A Break below 8,400 will imply bulls have lost momentum.
The highest I see BTC reaching is a possible $8,600-$8,700 range.
Long Term Bias (6+ months) - Bullish
Medium Term Bias (Next Week) - Neutral
Short Term Bias (Today) - Neutral
Long Term Target Prediction - Primary Wave 3, $35,000+ by 2019
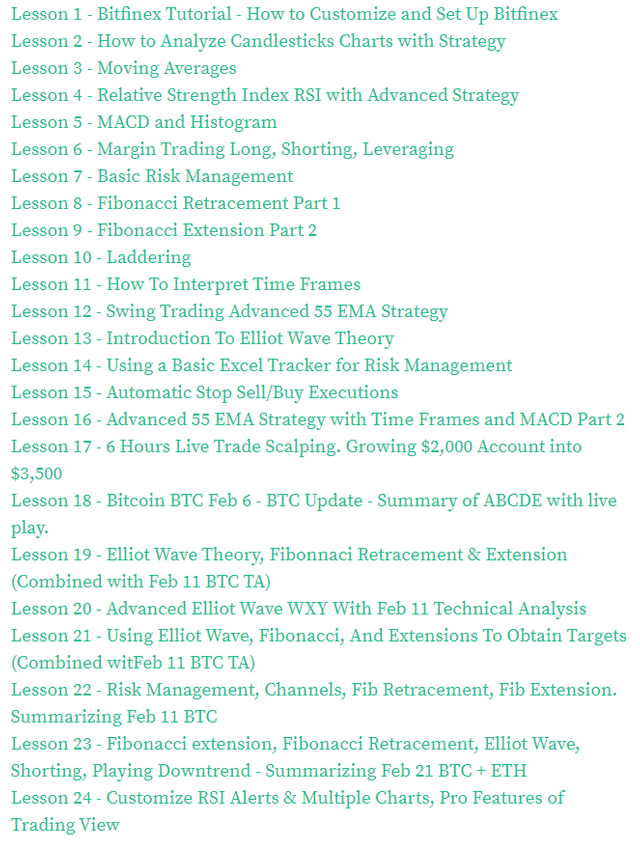
My Comprehensive List of Tutorials
Please consider upvoting if it has helped you
Please consider purchasing me a 33 ft' yacht
if you have reached incredible success. Click Below!

For future viewers: price of bitcoin at the moment of posting is 8506.00USD
Yep. Depending on where u are in this wooorld
Thanks for all the updates and excellent content. Really appreciate it! Will make sure to upvote your stuff. You know your shit m8.
Awesome post!! Keep it up and check out THIS POST as well as I have something similar.