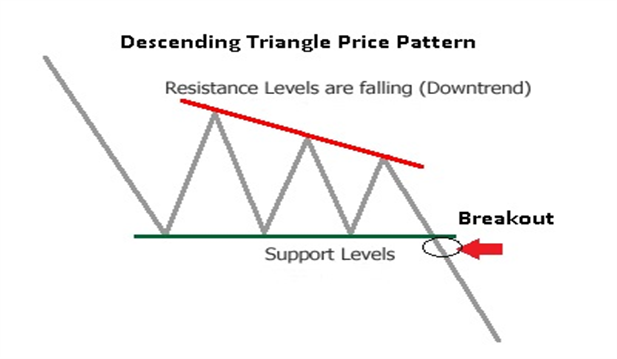
$3xxx - Descending triangle price pattern - The fate of Bitcoin
souce: https://goo.gl/images/1hEheu
Peter Brandt recently posted a tweet about Bitcoin, which I think is the fate of this oldest cryptocurrency. https://twitter.com/PeterLBrandt/status/1030989803674726401?s=19
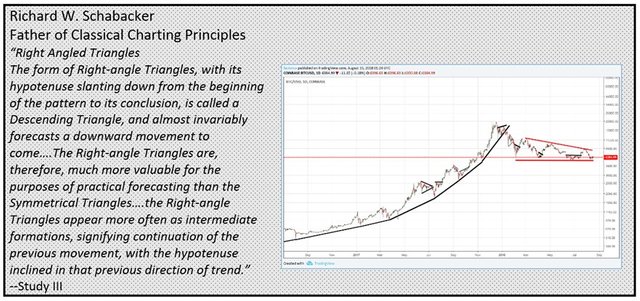
"Hey, I am just the messenger. If you have a problem, take it up with Schabacker, the originator of classical charting principles"
Classical Charting Principles: https://vi.scribd.com/doc/23553778/Technical-Analysis-and-Stock-Market-Profits
Regardless of when we see a falling triangle pattern, that is going to have a strong rebound ahead, continuing downward trend before. This is a strong discount model with very high reliability. The target of the model after the price break will be the height of the triangle.
Apply descending triangle price pattern to the Gold and Bitcoin analysis
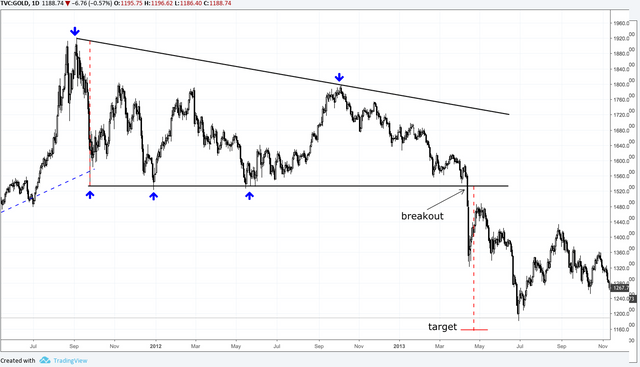
Gold Analysis D1 (past: 2011 -2013)
source: tradingview
The Triangle of Gold was formed during the period from early September 2011 to April 2013, lasting nearly 2 years. We see that the triangular model has two falling contacts on the top edge and three on the lower edge. After breaking the lower edge of the triangle, the gold price fell to the bottom of 1200, almost completing the 1160 target of the model (equal to the height of the triangle).
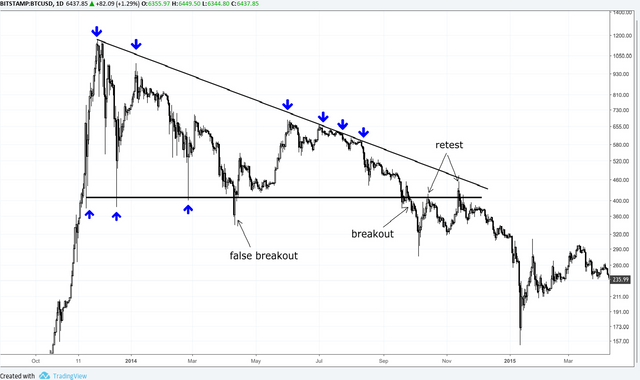
Bitcoin Analysis D1 (past: 2013 -2014)
source: tradingview
Late 2013 to November 2014, Bitcoin also formed a triangular reduction with many times hit. And this model also has the properties of a typical triangular fall: false breakout, true breakout, and two retest of the lower triangle. After breaking down, Bitcoin falls straight from 400 to bottom 157, losing 60% of value (calculated from ATH 1200, 87% of value).
Bitcoin Analysis D1 (now)
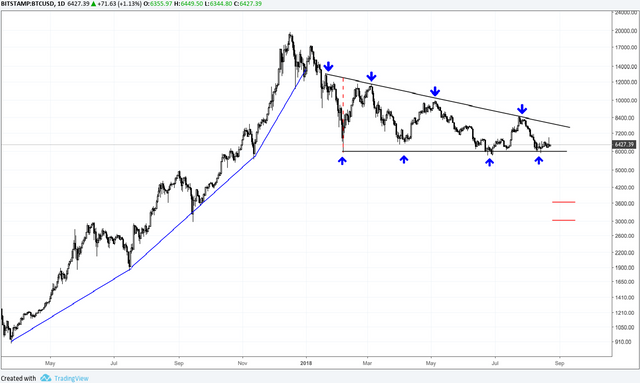
source: tradingview
The pattern is still familiar - the triangle is reduced. It is possible to confirm that this triangle is exactly reduced because it has many hits. If we break down, we expect Bitcoin to target $3000 - $3600, respectively, based on model size and past support.
So bad, right? This not fud, just Other views.
I hope everything will better, Peter Brandt will wrong and BTC will moon again.
What do you think about this pattern? Share your thinking with me.
Thanks!

Hi @phungminhtuan, you have received an upvote from
phungminhtuan. I'm the Vietnamese Community bot developed by witness @quochuy and powered by community SP delegations.Congratulations! This post has been upvoted from the communal account, @minnowsupport, by phungminhtuan from the Minnow Support Project. It's a witness project run by aggroed, ausbitbank, teamsteem, someguy123, neoxian, followbtcnews, and netuoso. The goal is to help Steemit grow by supporting Minnows. Please find us at the Peace, Abundance, and Liberty Network (PALnet) Discord Channel. It's a completely public and open space to all members of the Steemit community who voluntarily choose to be there.
If you would like to delegate to the Minnow Support Project you can do so by clicking on the following links: 50SP, 100SP, 250SP, 500SP, 1000SP, 5000SP.
Be sure to leave at least 50SP undelegated on your account.
Congratulations @phungminhtuan! You have completed the following achievement on Steemit and have been rewarded with new badge(s) :
Click on the badge to view your Board of Honor.
If you no longer want to receive notifications, reply to this comment with the word
STOPDo not miss the last post from @steemitboard:
SteemitBoard and the Veterans on Steemit - The First Community Badge.