FOR CRYPTO TRADERS. HIGH QUALITY CRYPTO NEWS : Bitcoin Price Analysis: Bitcoin Extends its Sideways Trajectory Until Bulls Break Above $7429
bitseven.com - Bitcoin is trading at support provided by the .618 Fibonacci Retracement level priced at $6453.
Upside is limited until bulls break above the September high at $7429.
Support moving forward; $6453, $6400, $6350, $6300, $6189, $6032, $6000, $5858.
Resistance moving forward; $6581, $6639, $6824, $7053, $7431, $7606, $7857.
The cryptocurrency currently trades around the $6472 handle after seeing a small -1% price decline over the past 7 rolling trading days.
Bitcoin retains the number 1 ranked position in terms of overall market cap value across the board. It currently holds a total market cap value of around $112 billion as the 66-month-old cryptocurrency sees a 14.48% price decline over the past 90 trading days. Bitcoin is now trading at a price that is 66% lower than the all-time high value.
Let us continue to analyze price action over the short term and continue to highlight any potential support and resistance zones moving forward.
Bitcoin Price Analysis
BTC/USD – SHORT TERM – DAILY CHART
Bitcoin Price Analysis Chart by TradingView
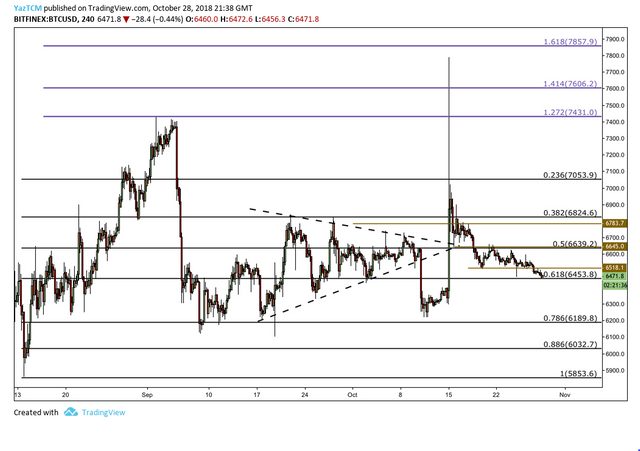
Analyzing price action from the short term perspective above, we can clearly see the previous swing leg when price action started from a low of $5858 on the 14th of August 2018 and extended to a high of $7429 on the 2nd of September 2018. This was a price increase totaling 26% from low to high.
We can see that as the market reached the high, it had met resistance at the 1.272 Fibonacci Extension level priced at $7431 before rolling over. The market fell until finding support at the .786 Fibonacci Retracement level priced at $6189. This Fibonacci Retracement level is measured from the entire swing leg outlined above.
Price action is now currently trading at the support provided by the .618 Fibonacci Retracement level priced at $6453. The market had recently slipped out of its previous range between $6645 – $6581 where it had been trading for the past few days.
Moving forward, if the bears continue with their bearish pressure to push the market below the support at the $6453 handle we can expect immediate support located below at the psychological round number handle of $6400 followed by $6300. Further support below can then be found at the .786 and .886 Fibonacci Retracement levels priced at $6189 and $6032, respectively.
If the bears continue to pressure the market below the strong support at $6000 we can expect immediate support below at the low seen during August 2018 priced at $5858.
Alternatively, on the other hand, if the bulls can regroup their efforts and push price action higher we can expect immediate resistance above to be located at the upper boundary of the markets previous range priced at $6645. This level of resistance is significant due to the .5 Fibonacci Retracement level also being located within this area.
Further resistance higher can be expected at the .382 and .235 Fibonacci Retracement levels priced at $6824 and $7053. If the bulls can then go on to break above the $7431 handle then further resistance above can be expected at the 1.414 and 1.618 Fibonacci Extension levels priced at $7606 and $7857 respectively.
bitseven.comBitcoin leveraged trade at 100x leverage maximum, 100% profit at 1% price raise
Make a profit whether the bitcoin price rises or falls
BITCOIN LEVERAGE TRADING YOU CAN TRUST