BTCUSD continuous UPDATES
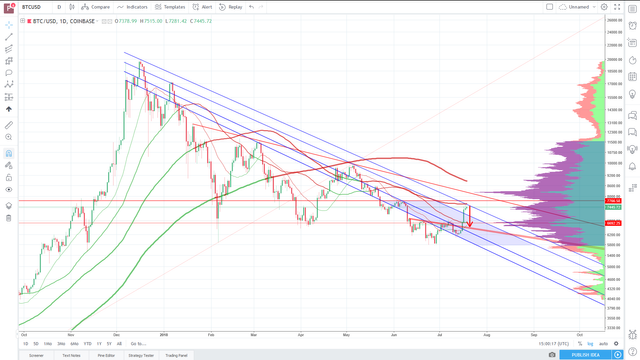
breaking out of as good as every pattern, finding resistance at 1.168 extension and downtrendline. bullflag and inverse h&s (depending on how u draw it) targets are way higher. my target at the moment is arround 8400$ for the first bigger stop.
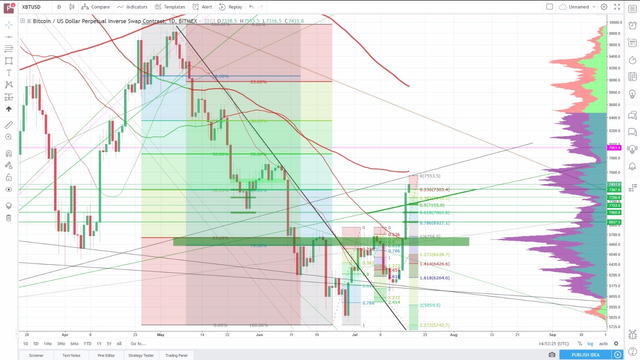
Again high reverse head & shoulder potential. 1st case, early breakout above 100MA daylie and parallel channel painted form the ATH (2nd screen) and over 7800$ and therefore a longer wave 3 than thought. 2nd scenario sideways movements for some days (wave 4 still ongoing), then a move to 7800$ resistance to finish wave 5 (this is the more likely scenario) and from there a ABC correction down, that again gives long entry possibilities because it still would give a plain reverse head&shoulders.
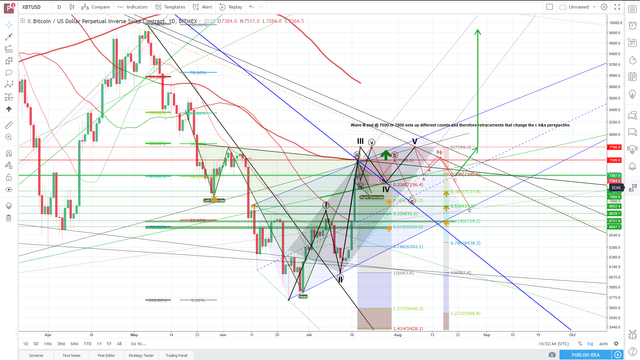
high short bounce potential, 0.618, 0.7861 1to1 retracement levels & 200day SMA, right below bullflag in the BTCSHORTS chart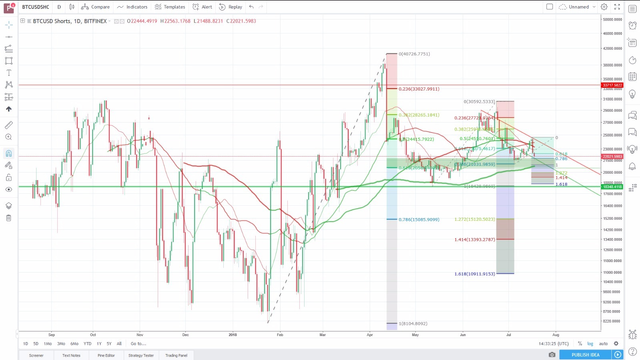
Entry levels für the potential downleg are shown below (outdated becauce BTC took slight move to 7600, look fiblevels in above screen for entry levels).
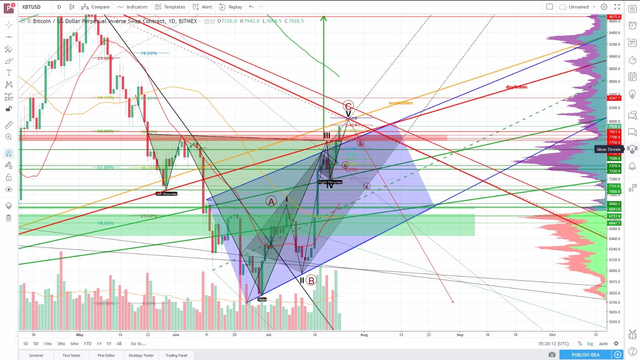
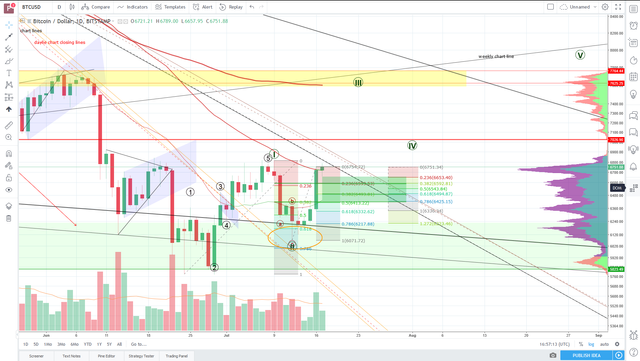
in case u missed it, the retracement finished. BTC established a come back close to the 6800 region. volume profile gap above, and the target for the reverse head and shoulders could mean a strong move up as soon as we establised to break the resistance if there was not the trendlinie we also have to break through. if we establish to break both even though the low timeframe rsi levels are pretty much extended, the better. As BTC has shown in the uptrend 2017 and before, a beginning bullrun starts with overextended rsi levels. if the bulls need some more breath we can see a retracement to the marked fibonacci wave extension levels and hopefully not bellow. If u take a close look at the waves we can see that wave III has started and as wave III in general is the longest, we have even more evidence for a strong bullmove and overextended RSI levels, before the wave IV retracement starts.
At this point i want to make a refference to my earlier posts to indicate signs of a bottom.
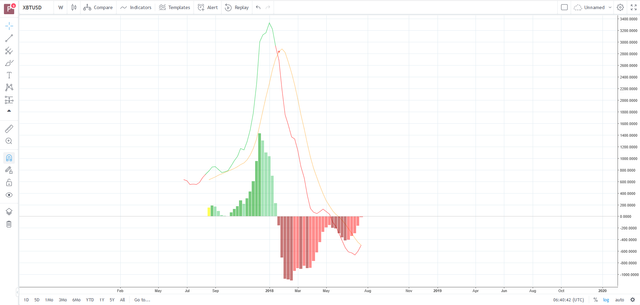
look especially for the uptrend channel in the weekly chart picture (5).
https://steemit.com/bitcoin/@risingwedge/3xhkcq-btcusd-continuous-updates
also look at the wyckoff and the buy market zone threats i created.
https://steemit.com/@risingwedge