BITCOIN cointiuous UPDATES
at the moment i im looking for something like this. but we got strong support beiing retested at the moment.
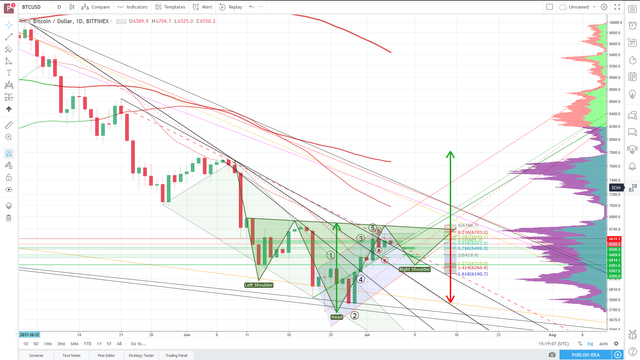
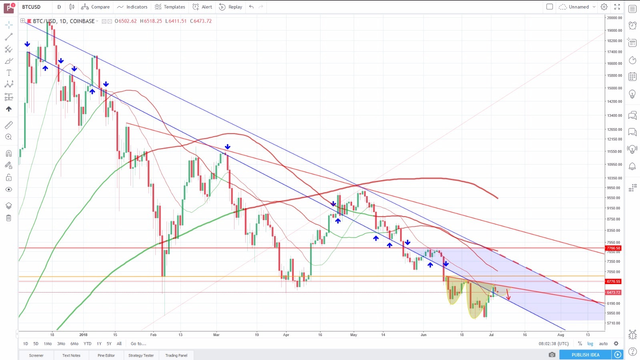
adjusted wave cycles. new support zone. keep bearflag in mind. if we break it, it can go to 7100-200. for now i think of an entry in between fib retracement level 0.5 to 0.618 with stoploss unter 0.768, because its last daylie low at the moment.
there was no early move to 6750-80. We have a 0.618 retracement bounce. maybe the A of an ABC wave correction, if we already had wave 5 finished. again we should not close under the yellow/red downtrendlines, we climbed above. a retest of these is still possible. the longer it takes us to retest these lines, the further we go down with time and the more possibility we got to fall through the bullflag support cluster (on the left side). also look at the next screen.
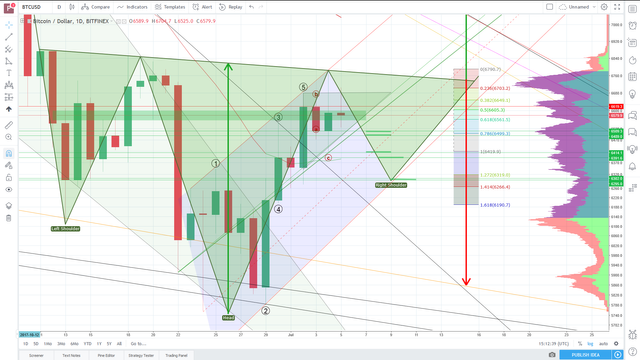
thisis an older screen of mine, where i drew a channel, we already bounced of on todays chart, this gives us a bit more potential to go through the 6750-80 zone early, but as always a retest is still possible and therefore this would really be an ABC wave. also keep the reverse head and shoulders and a potential for a bearflag with bottom arround 6100 in mind.
vvvvvvvvvvvvvvvvvvvvvvvvvvvvvvvvvvvvvvvvvvvvvvvvvvvvvvvvvvvvvvvv
i am thinking of a move up to ~6750 and then a move down for the right reverse shoulder (and later a ascending triangle on the daylie). if not we will build the right shoulder early, that would lead us to a equi pattern on the daylie timeframe.
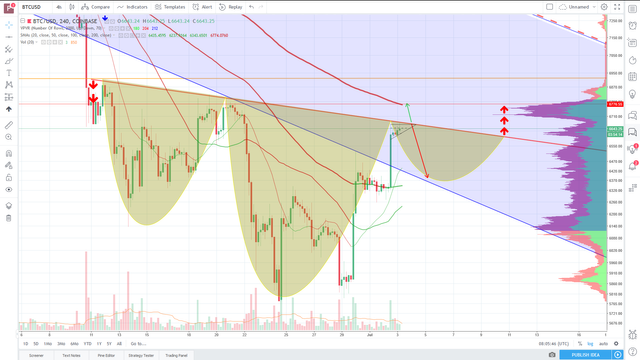
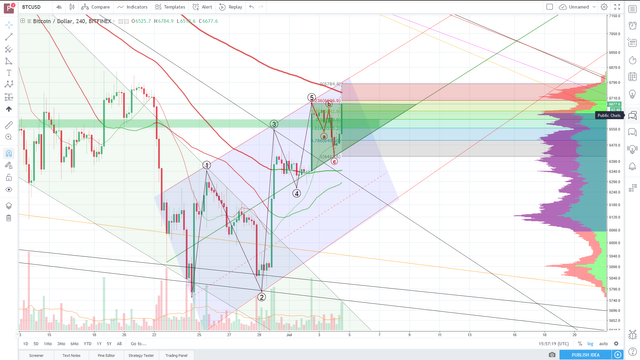
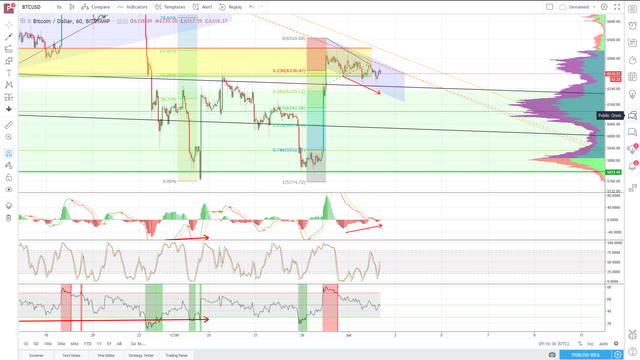
4h rsi, 0.5 fib wave extension and volumeprofile node + february and april lows (red horizontal) as actual resistance/firststop.
2nd marked volume profile node @ arround 6720 will be 0.618wave extension and next bigger resi.
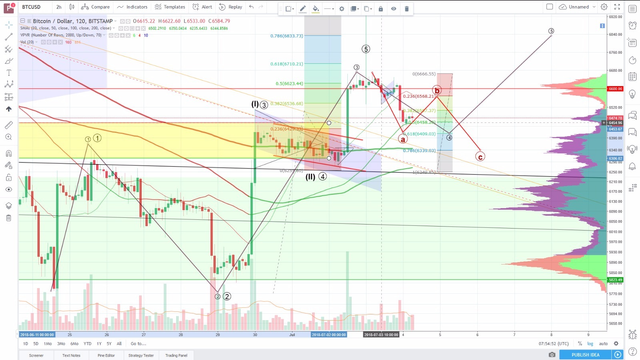
4-6h macd bearish divergent, rest looks fine. inner downtrend log trendlines passed, now wait for daylie close!
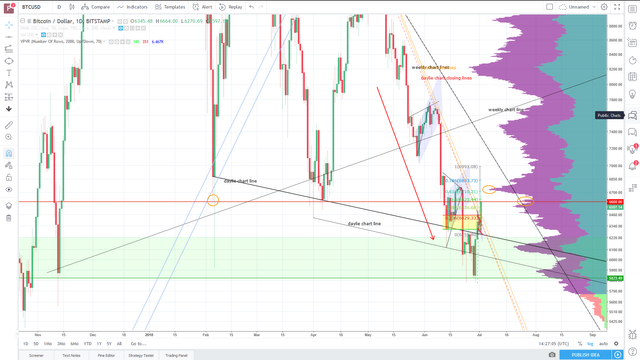
after some struggle we kicked all Moving Averages and broke the inner log downtrendlines and played out the bullflag simultaniously with good amount of volume.
 daylie divergence in rsi and macd etc. still up. inner log trendlines (orange&red) just pierced but not closed above. bullflag building with a slight divergence in the 1h chart. i tend to be more bullish beacause of the relativly good weekly and daylie closings in between the yellow zone, but we failed so often @ trendlines.
short update, confirming the set zone. daylie closed above linear trendlines . potential for lone extension has risen, but keep in mind that we are still under the log downtrend lines!

vvvvvvvvvvvvvvvvvvvvvvvvvvvvvvvvvvvvvvvvvvvvvvvvvvvvvvvvvvvvvvvv
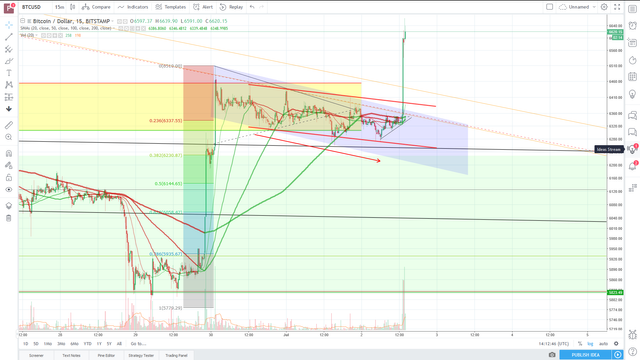
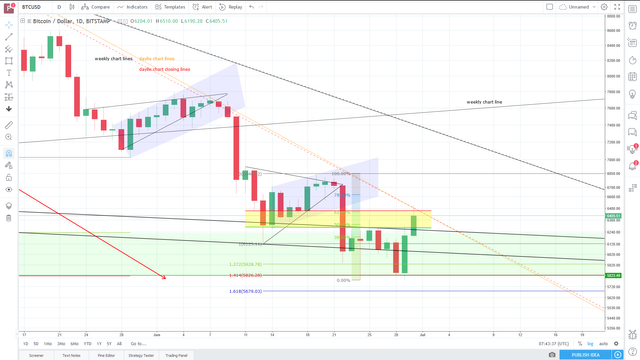
so. this one is a bit messy, but in my eyes we need to take care of linear and log downtrend lines and daylie + weekly closing prices above those.
right now we can only work with linear chart downtrendlines. these are drawn in black from the all time high and in red and orange from the 10k. the full lines are @candlewick tops and the non full are @closing prices.
weekly (only black downtrend line is weekly):
if we can establish a closing price at least in between 6450 (red line in the yellow box) and 6307 (green) we are good to go for building up more momentum next week. even a higher weekly closing low can establish a longtrend but i fear it would look more like a downtrend line dodge and therefore a beartrend continuation.
best would be if we beat the starting price of last weeks candle.
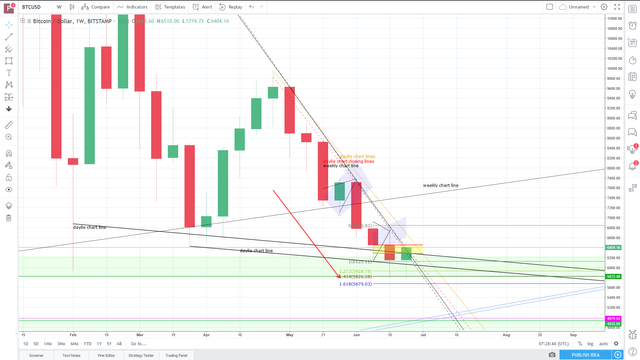
daylie: (only red and yellow downtrend line is daylie):
first chart is the linear one, where we can see that we did close under the red and orange downtrendlines. second chart is the log where we now struggle with the log downtrend lines. also keep the fibonacci levels in mind. i personally think the next 2 days (daylie, weekly and monthly closing prices) are significant for a potential buttom buildup.

Great post. It doesn't seem like you are getting the likes it deserves though. Have you checked out the upvote communities? You should check out steemengine. or steemfollower.com.