BTCUSD continuous UPDATES
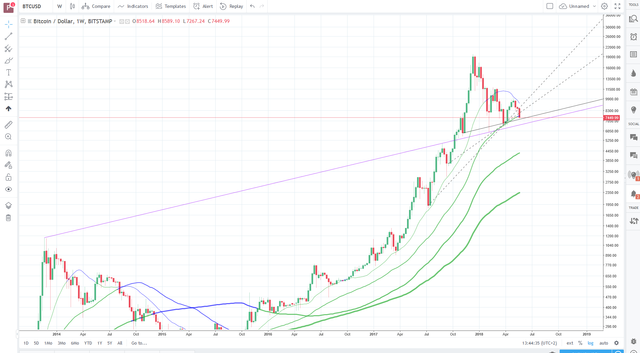
this chart is a new approach for indentifying supportpotential on the weekly chart. black line @weekly closing prices. violet line @weekly candle wicks. for this chart to be valid we need a bounce from the violet line or just a close above the black line.
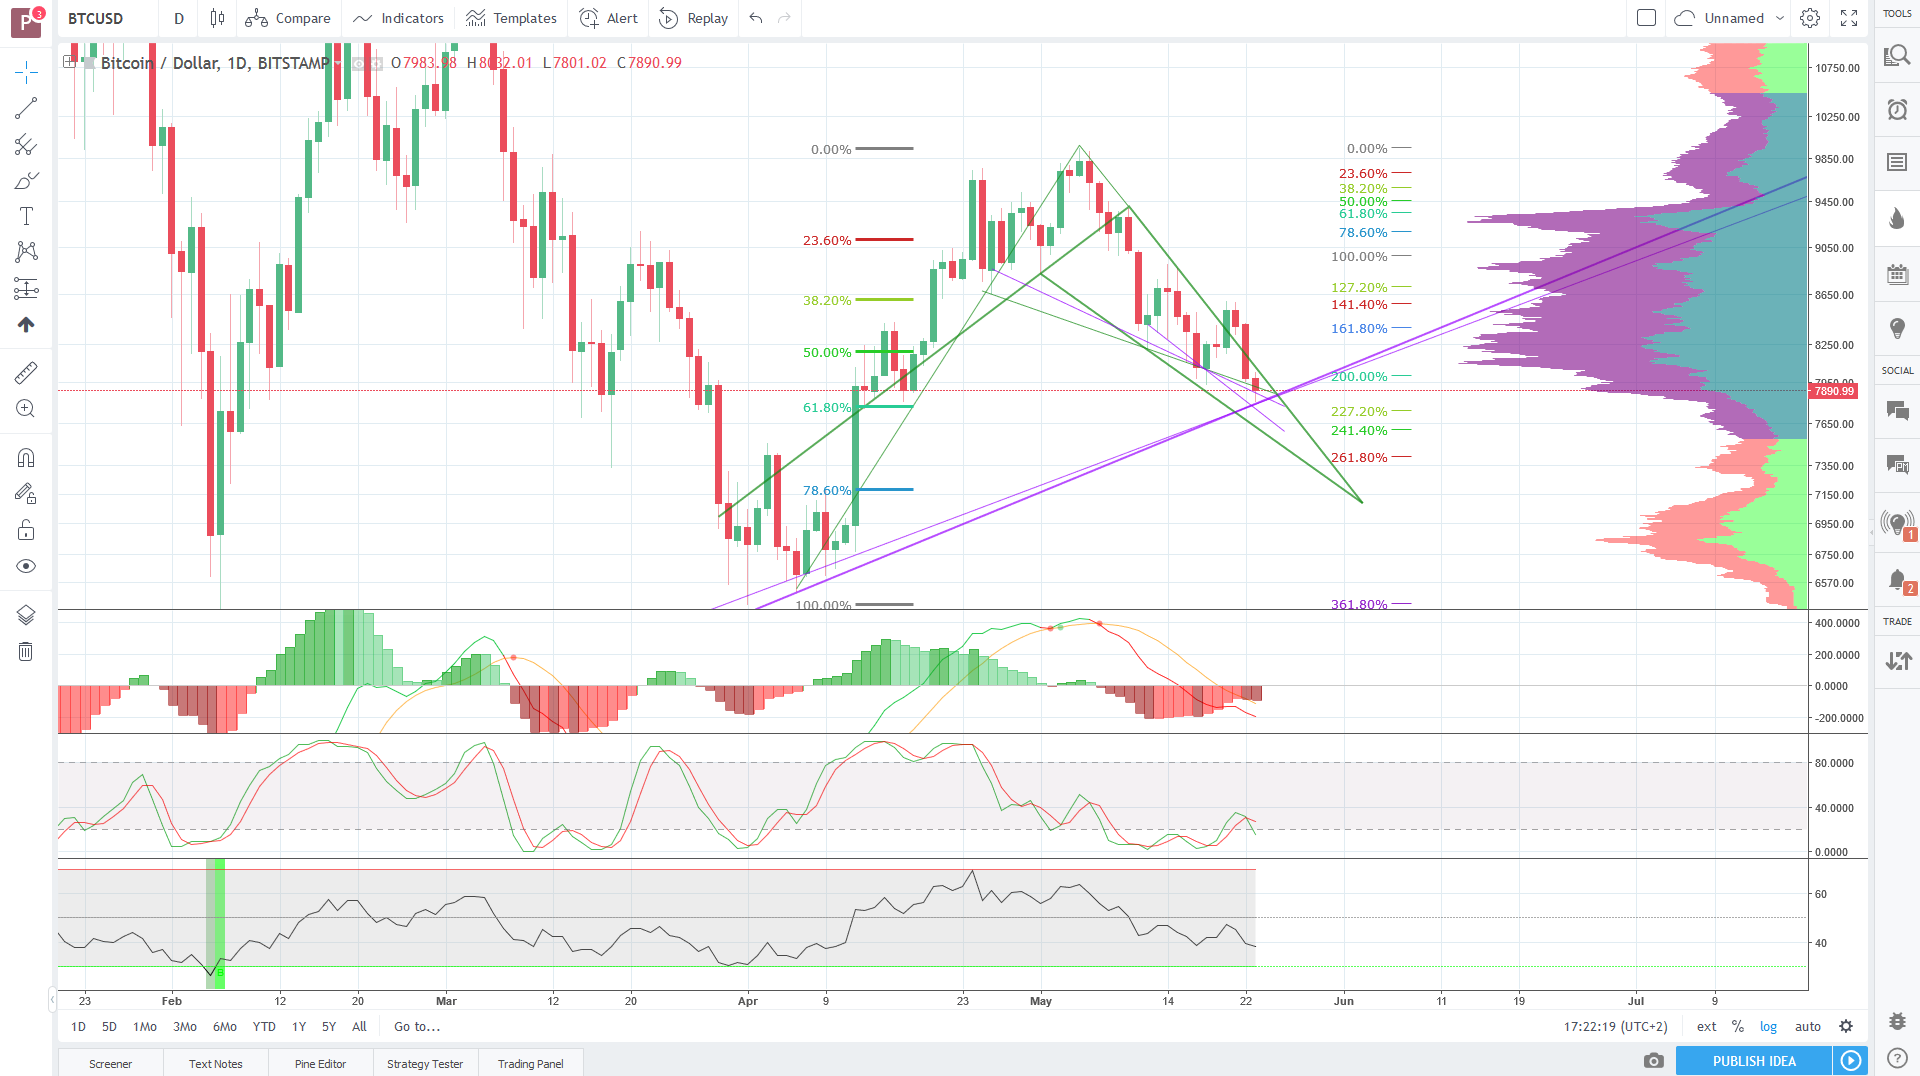
as long as we close weekly above 61.8 and more important above the violet trendlines, there is still potential for a bounce. daylie macd divergent.
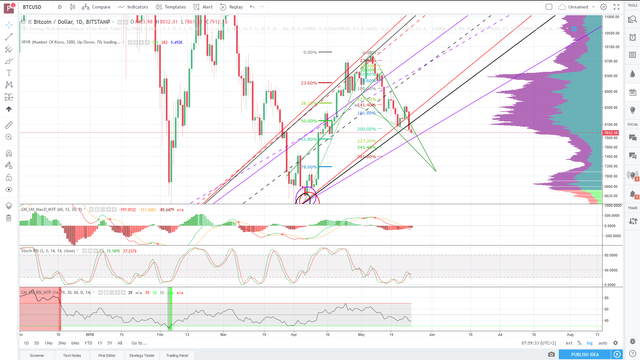
not much support at red and black trendline, 61.8 bounce possible but volume profile could surprise all those who wanted a bounce from there