Crypto Analysis Report 6-11-18 OmiseGo...Play The Range & Buy At $8
70% of the time Markets move in a trading range, making no significant moves either up or down. Range trading strategies are generally associated with direction-less Markets where price is meandering up and down within a range. Range trading is a strategy whereby a trader identifies demand and supply zones (or support and resistance areas) and buys at demand zones (support) and sells at supply zones (resistance).
Oscillators, such are MACD, CCI, RSI, etc are great indicators when range trading, not only because they show when the price is near the high or low of the price range, but also provide great confirmation for entries. For example, when using the RSI, wait for RSI to reach an extreme as price reaches a demand zone (support) then buy when RSI no longer oversold and when prices reaches a supply zone (resistance) then sell when RSI is no longer overbought.
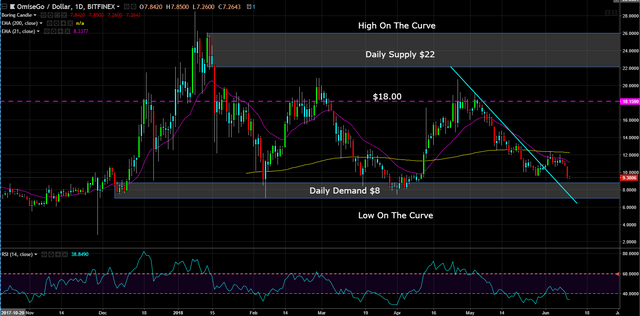
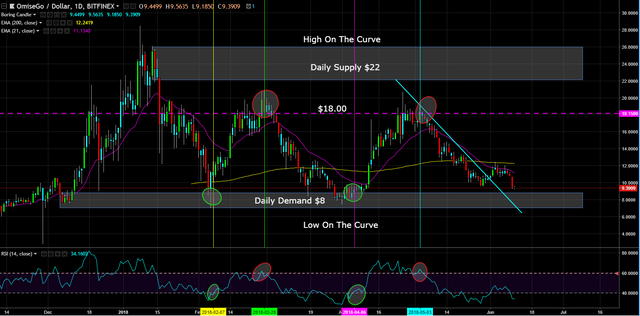
OmiseGo has been range bound since December. Back in December we saw a strong origin of demand forming when the buyers stepped in and bought OmiseGo at $8 and did not stop buying price until the sellers stepped in at $22. But since then, price has offered great opportunities to play the range between $8 and $18.
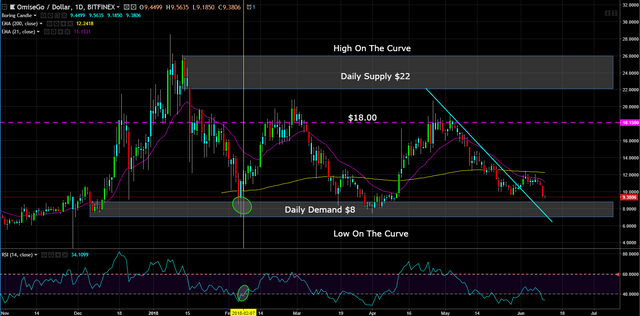
On 2/7 (yellow line) price came down to the demand zone/support at $8 and RSI was oversold. Price left the demand zone/support and the signal to buy was when the RSI was no longer oversold.
On 2/28 (green line) price came up to resistance at $18 and RSI was overbought. Price left the resistance area and the signal to sell was when the RSI was no longer overbought.
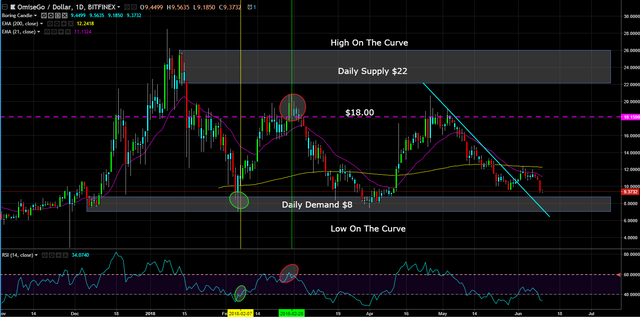
On 4/6 (pink line) price came down to the demand zone/support at $8 and RSI was oversold. Price left the demand zone/support and the signal to buy was when the RSI was no longer oversold.
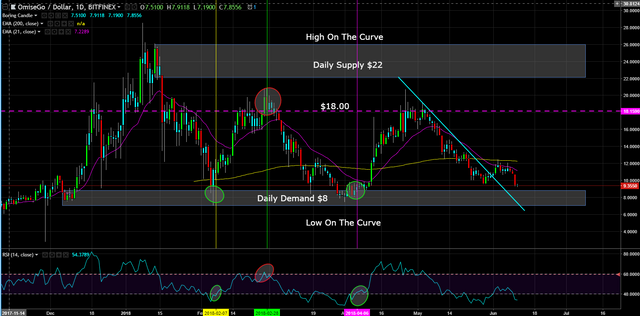
On 5/3 (aqua line) price came up to resistance at $18 and RSI was overbought. Price left the resistance area and the signal to sell was when the RSI was no longer overbought.
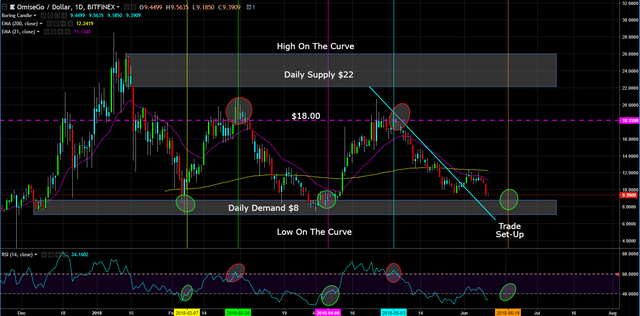
If price gets back down to the $8 demand zone, look for RSI to be oversold first. If and when price leaves the demand zone and RSI is no longer oversold, buy to go long with a target at $18. Stop out is at $6 (and no more than 2% of your account). The risk:reward on this trade set-up is 5:1.
This post is my personal opinion. I’m not a financial advisor, this isn't financial advise. Do your own research before making investment decisions.

Upvoted ($0.17) and resteemed by @investorsclub
Join the Investors Club if you are interested in investing.
Nice analysis. Haven't paid too much attention to OMG of late. A break of the daily demand would be savage.
Thanks @cryto-toast, lets see how things materialize over the next couple of weeks.
What is your take on BTC? Will 6500 hold? If not, how about the Feb lows?
I see more analysts calling for much lower prices, sub $5k, even down to the $3k’s, but I am interested in your take.
I think the $6000 is a do or die level . It was the original origin that push price to $19k back in late 2017. Price also reacted to that level twice before...Feb and Apr. I also see the analysts talk about sub $6k levels, but price needs to get through $6k first.
I do expect price to bounce from this area because we have a level ($6850) on level ($6000) demand zone situation. 1st target being the origin of the drop yesterday ($7500).
Awesome thanks for the reply and good analysis.
Good analysis. OMG is an interesting project.
Thanks @workin2005.